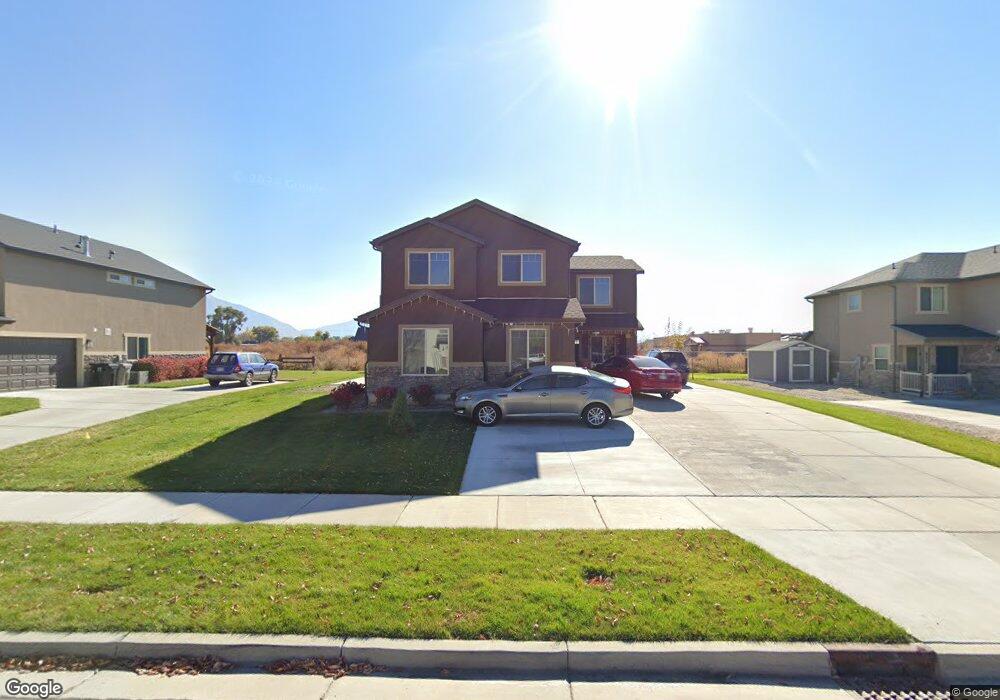
649 W 150 N Springville, UT 84663
Westfields North NeighborhoodEstimated Value: $490,000 - $530,000
4
Beds
3
Baths
1,643
Sq Ft
$312/Sq Ft
Est. Value
About This Home
This home is located at 649 W 150 N, Springville, UT 84663 and is currently estimated at $511,800, approximately $311 per square foot. 649 W 150 N is a home with nearby schools including Westside Elementary School, Springville Junior High School, and Springville High School.
Ownership History
Date
Name
Owned For
Owner Type
Purchase Details
Closed on
May 15, 2015
Sold by
Valleywide Ventures Llc
Bought by
Reyes Carlos Martinez and Demartinez Natalia Gaytan
Current Estimated Value
Home Financials for this Owner
Home Financials are based on the most recent Mortgage that was taken out on this home.
Original Mortgage
$213,928
Outstanding Balance
$162,192
Interest Rate
3.25%
Mortgage Type
FHA
Estimated Equity
$349,608
Purchase Details
Closed on
Feb 20, 2015
Sold by
Camberlango Development Group Llc
Bought by
Valleywide Ventures Llc
Home Financials for this Owner
Home Financials are based on the most recent Mortgage that was taken out on this home.
Original Mortgage
$172,469
Interest Rate
3.66%
Mortgage Type
Construction
Create a Home Valuation Report for This Property
The Home Valuation Report is an in-depth analysis detailing your home's value as well as a comparison with similar homes in the area
Home Values in the Area
Average Home Value in this Area
Purchase History
| Date | Buyer | Sale Price | Title Company |
|---|---|---|---|
| Reyes Carlos Martinez | -- | Provo Land Title Co | |
| Valleywide Ventures Llc | -- | Provo Land Title Co | |
| Camberlango Development Group Llc | -- | Provo Land Title Co |
Source: Public Records
Mortgage History
| Date | Status | Borrower | Loan Amount |
|---|---|---|---|
| Open | Reyes Carlos Martinez | $213,928 | |
| Previous Owner | Camberlango Development Group Llc | $172,469 |
Source: Public Records
Tax History Compared to Growth
Tax History
| Year | Tax Paid | Tax Assessment Tax Assessment Total Assessment is a certain percentage of the fair market value that is determined by local assessors to be the total taxable value of land and additions on the property. | Land | Improvement |
|---|---|---|---|---|
| 2025 | $2,435 | $480,000 | $189,200 | $290,800 |
| 2024 | $2,435 | $241,670 | $0 | $0 |
| 2023 | $2,389 | $239,360 | $0 | $0 |
| 2022 | $2,571 | $252,945 | $0 | $0 |
| 2021 | $2,190 | $334,900 | $122,600 | $212,300 |
| 2020 | $2,044 | $303,100 | $90,800 | $212,300 |
| 2019 | $1,804 | $272,000 | $87,400 | $184,600 |
| 2018 | $1,687 | $242,500 | $82,000 | $160,500 |
| 2017 | $1,480 | $112,860 | $0 | $0 |
| 2016 | $1,609 | $120,285 | $0 | $0 |
| 2015 | $744 | $56,700 | $0 | $0 |
| 2014 | $661 | $49,900 | $0 | $0 |
Source: Public Records
Map
Nearby Homes
- 637 W 150 N
- 637 W 150 N Unit 23
- 653 W 150 N Unit 21
- 623 W 150 N
- 623 W 150 N Unit 24
- 661 W 150 N
- 152 N 650 W
- 646 W 100 N
- 646 W 100 N Unit 10
- 153 N 600 W
- 601 W 150 N
- 601 W 150 N Unit 25
- 165 N 650 W
- 174 N 650 W
- 677 W 150 N Unit LOT 19
- 177 N 600 W
- 577 W 150 N
- 95 N 650 W Unit 7
- 230 N 650 W Unit 40
- 689 W 150 N