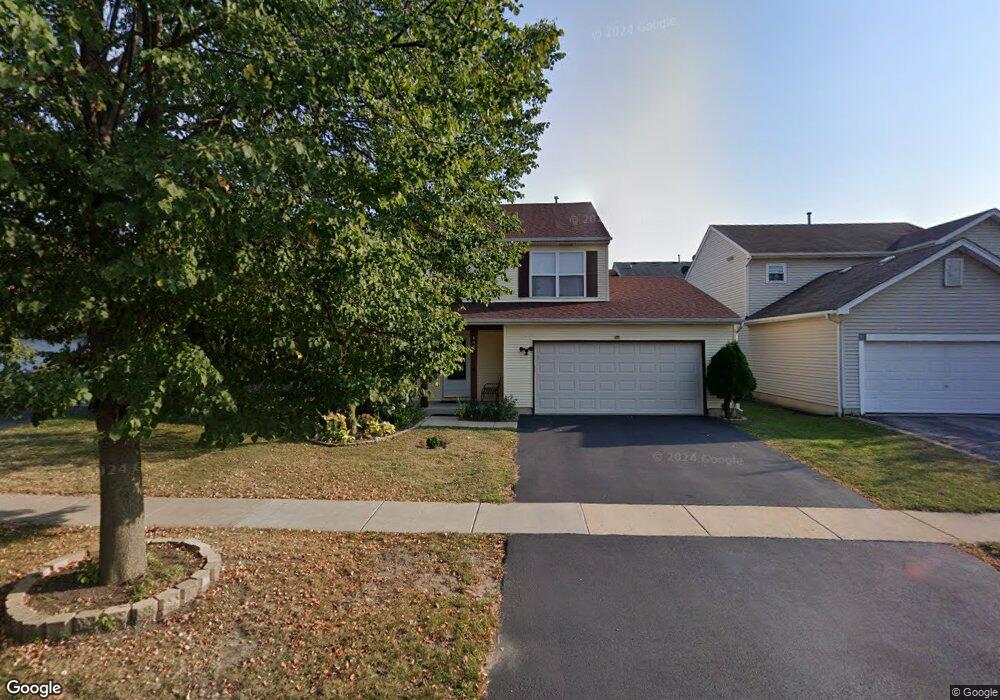
649 W Huron Hills Trail Round Lake Heights, IL 60073
Estimated Value: $304,000 - $333,638
3
Beds
3
Baths
1,683
Sq Ft
$188/Sq Ft
Est. Value
About This Home
This home is located at 649 W Huron Hills Trail, Round Lake Heights, IL 60073 and is currently estimated at $315,910, approximately $187 per square foot. 649 W Huron Hills Trail is a home located in Lake County with nearby schools including Olive C Martin School, Palombi Middle School, and Grant Community High School.
Ownership History
Date
Name
Owned For
Owner Type
Purchase Details
Closed on
Mar 18, 2009
Sold by
Hsbc Bank Usa National Association
Bought by
Mena Celestino and Mena Soriano Benita
Current Estimated Value
Home Financials for this Owner
Home Financials are based on the most recent Mortgage that was taken out on this home.
Original Mortgage
$141,284
Interest Rate
5.19%
Mortgage Type
Purchase Money Mortgage
Purchase Details
Closed on
Jun 6, 2008
Sold by
Sass Jason S and Case #07 Ch 2696
Bought by
Hsbc Bank Usa Na and Peoples Choice Home Loan Securities Trus
Purchase Details
Closed on
Oct 1, 2001
Sold by
Classic Homes Construction Inc
Bought by
Sass Jason P
Home Financials for this Owner
Home Financials are based on the most recent Mortgage that was taken out on this home.
Original Mortgage
$150,661
Interest Rate
6.69%
Mortgage Type
FHA
Create a Home Valuation Report for This Property
The Home Valuation Report is an in-depth analysis detailing your home's value as well as a comparison with similar homes in the area
Home Values in the Area
Average Home Value in this Area
Purchase History
| Date | Buyer | Sale Price | Title Company |
|---|---|---|---|
| Mena Celestino | $157,000 | First American Title | |
| Hsbc Bank Usa Na | -- | None Available | |
| Sass Jason P | $153,000 | -- |
Source: Public Records
Mortgage History
| Date | Status | Borrower | Loan Amount |
|---|---|---|---|
| Previous Owner | Mena Celestino | $141,284 | |
| Previous Owner | Sass Jason P | $150,661 |
Source: Public Records
Tax History Compared to Growth
Tax History
| Year | Tax Paid | Tax Assessment Tax Assessment Total Assessment is a certain percentage of the fair market value that is determined by local assessors to be the total taxable value of land and additions on the property. | Land | Improvement |
|---|---|---|---|---|
| 2024 | $6,235 | $81,473 | $12,256 | $69,217 |
| 2023 | $5,613 | $71,986 | $10,829 | $61,157 |
| 2022 | $5,613 | $61,946 | $9,575 | $52,371 |
| 2021 | $5,343 | $57,544 | $8,895 | $48,649 |
| 2020 | $5,325 | $55,700 | $8,610 | $47,090 |
| 2019 | $5,454 | $53,532 | $8,275 | $45,257 |
| 2018 | $4,702 | $46,625 | $9,893 | $36,732 |
| 2017 | $4,665 | $45,381 | $9,629 | $35,752 |
| 2016 | $4,793 | $43,543 | $9,239 | $34,304 |
| 2015 | $4,592 | $40,668 | $8,629 | $32,039 |
| 2014 | $4,186 | $39,353 | $7,152 | $32,201 |
| 2012 | $4,317 | $39,542 | $7,186 | $32,356 |
Source: Public Records
Map
Nearby Homes
- 686 Chippewa Cir
- 2292 Iroquois Ln
- 411 Red Cedar Rd Unit I
- 535 Normandie Ln
- 862 Chesapeake Trail
- 2033 Westview Ln Unit 5
- 2011 Westview Ln
- 1993 Westview Ln
- 512 Meadow Hill Ln
- 330 Greenview Ln
- 446 Meadow Green Ln Unit 8
- 1724 Lotus Dr
- 908 Flintwood Ct
- 1998 N Karen Ln
- 614 W Pheasant Ct
- 81 W Dahlia Ln
- 24570 W Blackcherry Ln
- 66 W Lindsay Dr
- 1610 Goldenrod Terrace
- 51 W Rustic Ln
- 641 W Huron Hills Trail
- 655 W Huron Hills Trail
- 633 W Huron Hills Trail
- 646 Seminole Ct
- 640 Seminole Ct
- 667 W Huron Hills Trail
- 660 Seminole Ct
- 632 Seminole Ct
- 648 W Huron Hills Trail
- 666 Seminole Ct
- 640 W Huron Hills Trail
- 654 W Huron Hills Trail
- 675 W Huron Hills Trail
- 660 W Huron Hills Trail
- 634 W Huron Hills Trail
- 672 Seminole Ct
- 666 W Huron Hills Trail
- 681 W Huron Hills Trail
- 668 W Huron Hills Trail
- 2207 Mohican Dr