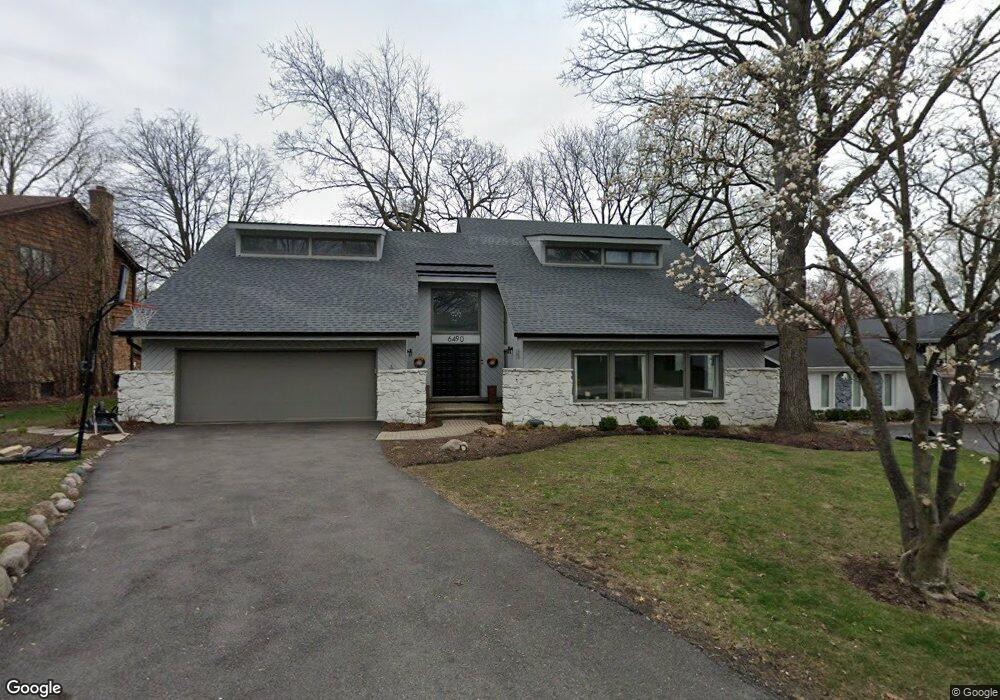
6490 Big Bear Dr Indian Head Park, IL 60525
Estimated Value: $775,000 - $969,000
5
Beds
3
Baths
3,659
Sq Ft
$230/Sq Ft
Est. Value
About This Home
This home is located at 6490 Big Bear Dr, Indian Head Park, IL 60525 and is currently estimated at $843,175, approximately $230 per square foot. 6490 Big Bear Dr is a home located in Cook County with nearby schools including Highlands Elementary School, Highlands Middle School, and Lyons Township High School.
Ownership History
Date
Name
Owned For
Owner Type
Purchase Details
Closed on
May 11, 2016
Sold by
Kelly Timothy M and Kelly Stephanie J
Bought by
Dinn Robert B and Dinn Avery
Current Estimated Value
Home Financials for this Owner
Home Financials are based on the most recent Mortgage that was taken out on this home.
Original Mortgage
$415,200
Outstanding Balance
$330,097
Interest Rate
3.62%
Mortgage Type
New Conventional
Estimated Equity
$513,078
Purchase Details
Closed on
Apr 19, 1996
Sold by
Egan Edward J
Bought by
Kelly Stephanie J and Kelly Timothy M
Home Financials for this Owner
Home Financials are based on the most recent Mortgage that was taken out on this home.
Original Mortgage
$150,000
Interest Rate
7.97%
Mortgage Type
Balloon
Purchase Details
Closed on
Nov 15, 1994
Sold by
Egan Edward J
Bought by
Egan Edward J
Create a Home Valuation Report for This Property
The Home Valuation Report is an in-depth analysis detailing your home's value as well as a comparison with similar homes in the area
Home Values in the Area
Average Home Value in this Area
Purchase History
| Date | Buyer | Sale Price | Title Company |
|---|---|---|---|
| Dinn Robert B | $519,000 | Fidelity National Title | |
| Kelly Stephanie J | $385,000 | Attorneys Natl Title Network | |
| Egan Edward J | -- | -- |
Source: Public Records
Mortgage History
| Date | Status | Borrower | Loan Amount |
|---|---|---|---|
| Open | Dinn Robert B | $415,200 | |
| Previous Owner | Kelly Stephanie J | $150,000 |
Source: Public Records
Tax History Compared to Growth
Tax History
| Year | Tax Paid | Tax Assessment Tax Assessment Total Assessment is a certain percentage of the fair market value that is determined by local assessors to be the total taxable value of land and additions on the property. | Land | Improvement |
|---|---|---|---|---|
| 2024 | $14,728 | $66,587 | $9,507 | $57,080 |
| 2023 | $10,579 | $69,000 | $9,507 | $59,493 |
| 2022 | $10,579 | $43,134 | $8,355 | $34,779 |
| 2021 | $10,063 | $43,133 | $8,354 | $34,779 |
| 2020 | $10,653 | $43,133 | $8,354 | $34,779 |
| 2019 | $12,850 | $51,900 | $7,490 | $44,410 |
| 2018 | $12,607 | $51,900 | $7,490 | $44,410 |
| 2017 | $12,244 | $51,900 | $7,490 | $44,410 |
| 2016 | $13,416 | $53,827 | $6,626 | $47,201 |
| 2015 | $15,202 | $61,694 | $6,626 | $55,068 |
| 2014 | $15,015 | $61,694 | $6,626 | $55,068 |
| 2013 | $11,572 | $50,534 | $6,626 | $43,908 |
Source: Public Records
Map
Nearby Homes
- 6441 Blackhawk Trail
- 11407 Hiawatha Ln
- 11226 Hiawatha Ln
- 11300 Sequoya Ln
- 127 Acacia Cir Unit 505
- 191 Cascade Dr
- 11361 W Plainfield Rd
- 6818 Joliet Rd Unit 9
- 170 Cascade Dr
- 6262 Edgebrook Ln E
- 164 Cascade Dr
- 6810 Joliet Rd Unit 5
- 904 Hickory Dr
- 6001 Wolf Rd
- 6447 Manor Dr
- 6008 Burr Oak (Lot 129) Dr
- 909 Red Oak Dr
- 7445 Willow Springs Rd
- The Fenwick Plan at Timber Trails of Western Springs
- The Brunswick Plan at Timber Trails of Western Springs
- 6482 Big Bear Dr
- 6498 Big Bear Dr
- 6497 Cherokee Dr
- 6450 Indianhead Trail
- 6442 Indianhead Trail
- 6489 Cherokee Dr
- 6489 Big Bear Dr
- 6495 Big Bear Dr
- 6481 Cherokee Dr
- 6458 Indianhead Trail
- 6481 Big Bear Dr
- 6503 Big Bear Dr
- 6473 Big Bear Dr
- 6468 Big Bear Dr
- 6473 Cherokee Dr
- 6505 Cherokee Dr
- 6498 Apache Dr
- 6506 Apache Dr
- 6465 Cherokee Dr
- 6490 Apache Dr