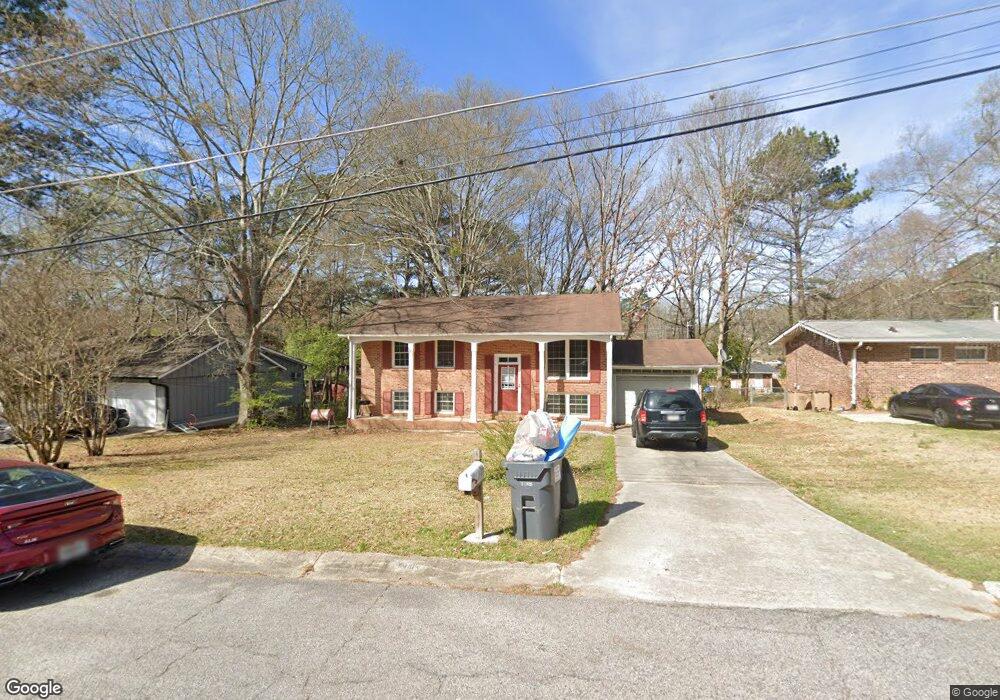
6491 Sinclair Place Morrow, GA 30260
Estimated Value: $200,880 - $273,000
3
Beds
2
Baths
1,825
Sq Ft
$128/Sq Ft
Est. Value
About This Home
This home is located at 6491 Sinclair Place, Morrow, GA 30260 and is currently estimated at $234,220, approximately $128 per square foot. 6491 Sinclair Place is a home located in Clayton County with nearby schools including William M. Mcgarrah Elementary School, Morrow Middle School, and Morrow High School.
Ownership History
Date
Name
Owned For
Owner Type
Purchase Details
Closed on
Jul 29, 2019
Sold by
Le Thi Ngoc Trang
Bought by
Vanle Luu Van
Current Estimated Value
Purchase Details
Closed on
Sep 29, 2011
Sold by
Vanvanle Thoa Van
Bought by
Le Thi Ngoc Trang and Ledang Family Trust
Purchase Details
Closed on
Jun 26, 2009
Sold by
Le Luu
Bought by
Vanle Thoa and Le Thi N
Purchase Details
Closed on
Mar 30, 2009
Sold by
Citimortgage Inc
Bought by
Le Luu
Purchase Details
Closed on
Feb 3, 2009
Sold by
Johnson Lucius and Johnson Christine L
Bought by
Citimortgage Inc
Purchase Details
Closed on
Sep 21, 2000
Sold by
Johnson Lucius and Johnson Christine L
Bought by
Johnson Lucius and Johnson Christine L
Home Financials for this Owner
Home Financials are based on the most recent Mortgage that was taken out on this home.
Original Mortgage
$88,000
Interest Rate
7.97%
Mortgage Type
New Conventional
Create a Home Valuation Report for This Property
The Home Valuation Report is an in-depth analysis detailing your home's value as well as a comparison with similar homes in the area
Home Values in the Area
Average Home Value in this Area
Purchase History
| Date | Buyer | Sale Price | Title Company |
|---|---|---|---|
| Vanle Luu Van | -- | -- | |
| Le Thi Ngoc Trang | -- | -- | |
| Vanle Thoa | $37,000 | -- | |
| Le Luu | $24,000 | -- | |
| Citimortgage Inc | $30,037 | -- | |
| Johnson Lucius | -- | -- |
Source: Public Records
Mortgage History
| Date | Status | Borrower | Loan Amount |
|---|---|---|---|
| Previous Owner | Johnson Lucius | $88,000 |
Source: Public Records
Tax History
| Year | Tax Paid | Tax Assessment Tax Assessment Total Assessment is a certain percentage of the fair market value that is determined by local assessors to be the total taxable value of land and additions on the property. | Land | Improvement |
|---|---|---|---|---|
| 2025 | $2,960 | $77,280 | $8,000 | $69,280 |
| 2024 | $3,030 | $77,680 | $8,000 | $69,680 |
| 2023 | $2,585 | $71,600 | $8,000 | $63,600 |
| 2022 | $2,422 | $61,720 | $8,000 | $53,720 |
| 2021 | $1,777 | $45,000 | $8,000 | $37,000 |
| 2020 | $1,526 | $38,143 | $8,000 | $30,143 |
| 2019 | $1,390 | $34,238 | $6,400 | $27,838 |
| 2018 | $1,312 | $32,312 | $6,400 | $25,912 |
| 2017 | $1,126 | $27,679 | $6,400 | $21,279 |
| 2016 | $1,099 | $27,004 | $6,400 | $20,604 |
| 2015 | $823 | $0 | $0 | $0 |
| 2014 | $920 | $23,123 | $6,400 | $16,723 |
Source: Public Records
Map
Nearby Homes
- 6463 Maddox Rd
- 6413 Maddox Rd
- 6560 Maddox Rd
- 6359 Lanier Rd
- 2497 Celina Ct
- 2455 Lake Harbin Rd
- 6566 Melandre Dr
- 2617 Terrace Pkwy
- 2575 Stratford Ln
- 2613 Stratford Ln Unit 3
- 6584 Sleepy Hollow Ln
- 2514 Harbin Village Ct
- 6495 Revena Dr
- 6633 Cameron Rd
- 6203 Castlewood Dr
- 2117 Amish Ct
- 6200 Fieldcrest Dr Unit 3
- 6380 Mount Zion Blvd
- 6205 Fieldcrest Dr
- 6155 Landover Cir Unit 2
- 6499 Sinclair Place
- 6483 Sinclair Place
- 6492 Maddox Rd
- 6484 Maddox Rd
- 6507 Sinclair Place
- 6475 Sinclair Place
- 6498 Maddox Rd
- 6478 Maddox Rd
- 6490 Sinclair Place
- 6498 Sinclair Place
- 6508 Maddox Rd
- 6482 Sinclair Place
- 6515 Sinclair Place
- 6467 Sinclair Place
- 6506 Sinclair Place
- 6470 Maddox Rd
- 6474 Sinclair Place
- 6523 Sinclair Place
- 6518 Sinclair Place
- 6459 Sinclair Place
Your Personal Tour Guide
Ask me questions while you tour the home.