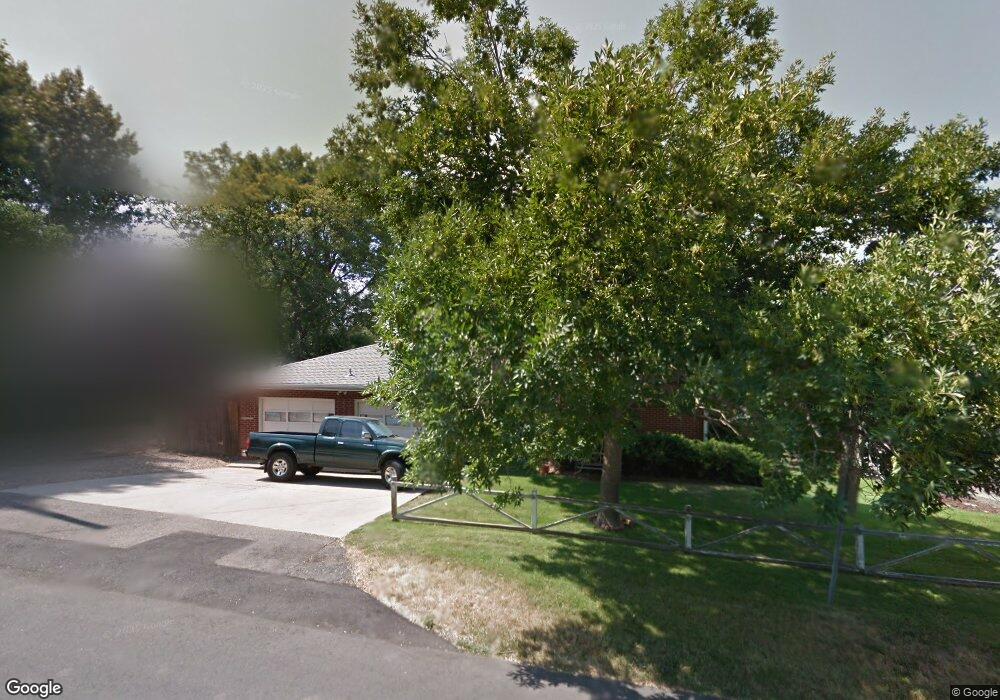
6492 Garrison St Arvada, CO 80004
Scenic Heights NeighborhoodEstimated Value: $721,000 - $777,293
4
Beds
3
Baths
3,023
Sq Ft
$248/Sq Ft
Est. Value
About This Home
This home is located at 6492 Garrison St, Arvada, CO 80004 and is currently estimated at $750,323, approximately $248 per square foot. 6492 Garrison St is a home located in Jefferson County with nearby schools including Secrest Elementary School, Peck Elementary School, and Arvada K-8.
Ownership History
Date
Name
Owned For
Owner Type
Purchase Details
Closed on
Jul 25, 2017
Sold by
Wood Owen D and Wood Susan L
Bought by
Gingerich Niya L and Gingerich Grant
Current Estimated Value
Home Financials for this Owner
Home Financials are based on the most recent Mortgage that was taken out on this home.
Original Mortgage
$340,000
Outstanding Balance
$282,638
Interest Rate
3.91%
Mortgage Type
New Conventional
Estimated Equity
$467,685
Purchase Details
Closed on
Aug 29, 2001
Sold by
Zeller Steve Lee and Zeller Jessica
Bought by
Wood Owen D and Wood Susan L
Home Financials for this Owner
Home Financials are based on the most recent Mortgage that was taken out on this home.
Original Mortgage
$206,250
Interest Rate
7.44%
Purchase Details
Closed on
May 30, 1997
Sold by
Johansson Ivan E and Geraldine Johansson
Bought by
Zeller Steve Lee and Zeller Jessica
Home Financials for this Owner
Home Financials are based on the most recent Mortgage that was taken out on this home.
Original Mortgage
$131,250
Interest Rate
8.17%
Create a Home Valuation Report for This Property
The Home Valuation Report is an in-depth analysis detailing your home's value as well as a comparison with similar homes in the area
Home Values in the Area
Average Home Value in this Area
Purchase History
| Date | Buyer | Sale Price | Title Company |
|---|---|---|---|
| Gingerich Niya L | $525,000 | Heritage Title Company | |
| Wood Owen D | $275,000 | Title Services | |
| Zeller Steve Lee | $175,000 | First American Heritage Titl |
Source: Public Records
Mortgage History
| Date | Status | Borrower | Loan Amount |
|---|---|---|---|
| Open | Gingerich Niya L | $340,000 | |
| Previous Owner | Wood Owen D | $206,250 | |
| Previous Owner | Zeller Steve Lee | $131,250 |
Source: Public Records
Tax History Compared to Growth
Tax History
| Year | Tax Paid | Tax Assessment Tax Assessment Total Assessment is a certain percentage of the fair market value that is determined by local assessors to be the total taxable value of land and additions on the property. | Land | Improvement |
|---|---|---|---|---|
| 2024 | $4,561 | $47,020 | $23,178 | $23,842 |
| 2023 | $4,561 | $47,020 | $23,178 | $23,842 |
| 2022 | $3,651 | $37,277 | $17,362 | $19,915 |
| 2021 | $3,711 | $38,350 | $17,862 | $20,488 |
| 2020 | $3,450 | $35,748 | $16,386 | $19,362 |
| 2019 | $3,403 | $35,748 | $16,386 | $19,362 |
| 2018 | $3,045 | $31,098 | $10,528 | $20,570 |
| 2017 | $2,142 | $31,098 | $10,528 | $20,570 |
| 2016 | $1,795 | $26,606 | $7,223 | $19,383 |
| 2015 | $1,552 | $26,606 | $7,223 | $19,383 |
| 2014 | $1,552 | $23,286 | $6,992 | $16,294 |
Source: Public Records
Map
Nearby Homes
- 6455 Field St
- 9075 W 66th Ave
- 9173 W 66th Place
- 6444 Holland Cir
- 6250 Everett Ct Unit E
- 6240 Everett Ct Unit F
- 6240 Everett Ct Unit D
- 6750 Garrison St
- 9175 Cole Dr
- 6200 Estes St
- 9656 Rensselaer Dr
- 6580 Independence Way
- 6842 Garland St
- 9667 W 63rd Ave
- 6355 Carr St
- 8710 Alta Vista Dr
- 9743 W 67th Place
- 6138 Iris Way
- 6463 Brentwood St
- 6532 Kipling St
- 6480 Garrison St
- 9150 W 65th Ave
- 6475 Garrison St
- 6500 Garrison St
- 6446 Garrison St
- 9130 W 65th Ave
- 9085 W 64th Place
- 6555 Garrison St
- 9071 W 65th Ave
- 9075 W 64th Place
- 6455 Garrison St
- 9070 W 65th Ave
- 9072 W 65th Place
- 6430 Garrison St
- 9051 W 65th Ave
- 6500 Garland St
- 6575 Garrison St
- 9050 W 65th Ave
- 6435 Garrison St
- 9150 W 64th Place