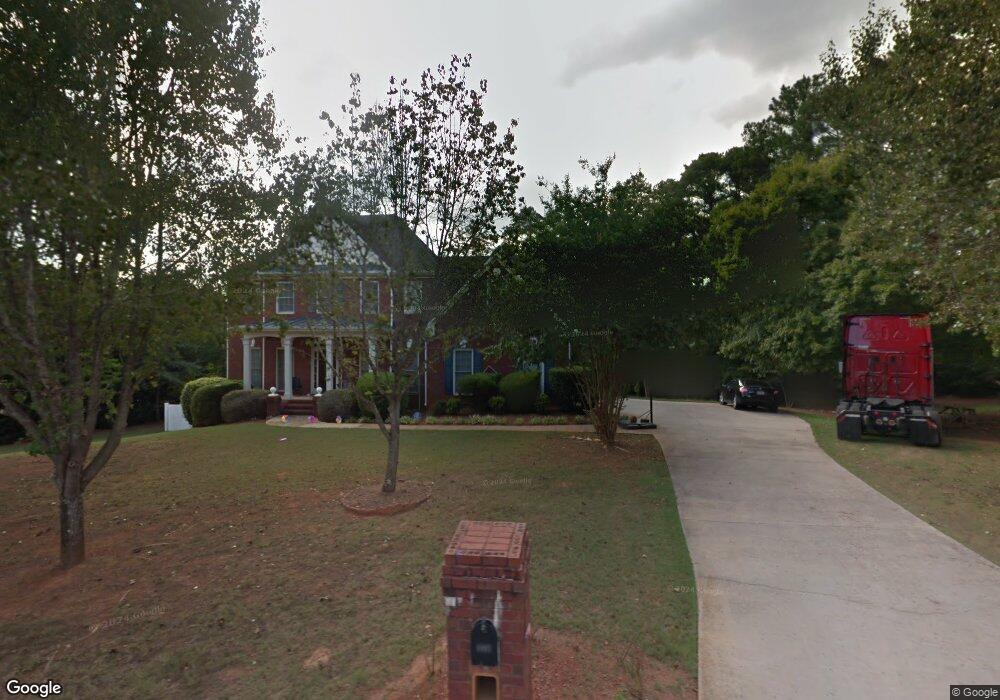
6493 Bellevue Dr SW Unit 6 Conyers, GA 30094
Estimated Value: $429,917 - $498,000
5
Beds
3
Baths
3,048
Sq Ft
$153/Sq Ft
Est. Value
About This Home
This home is located at 6493 Bellevue Dr SW Unit 6, Conyers, GA 30094 and is currently estimated at $466,979, approximately $153 per square foot. 6493 Bellevue Dr SW Unit 6 is a home located in Rockdale County with nearby schools including Lorraine Elementary School, Gen. Ray Davis Middle School, and Salem High School.
Ownership History
Date
Name
Owned For
Owner Type
Purchase Details
Closed on
Jun 26, 2020
Sold by
Jenkins Sharon M
Bought by
The Sharon M Jenkins Liv Trust
Current Estimated Value
Purchase Details
Closed on
Jun 22, 2018
Sold by
Jenkins Sharon M
Bought by
Jenkins Arrington R
Purchase Details
Closed on
Apr 4, 2016
Sold by
Hamer Gregory A
Bought by
Jenkins Sharon M
Home Financials for this Owner
Home Financials are based on the most recent Mortgage that was taken out on this home.
Original Mortgage
$228,779
Interest Rate
3.25%
Mortgage Type
FHA
Purchase Details
Closed on
Aug 27, 1999
Sold by
Classic Smith Homes Inc
Bought by
Hamer Gregory A and Denise L
Home Financials for this Owner
Home Financials are based on the most recent Mortgage that was taken out on this home.
Original Mortgage
$187,900
Interest Rate
8.22%
Mortgage Type
New Conventional
Create a Home Valuation Report for This Property
The Home Valuation Report is an in-depth analysis detailing your home's value as well as a comparison with similar homes in the area
Home Values in the Area
Average Home Value in this Area
Purchase History
| Date | Buyer | Sale Price | Title Company |
|---|---|---|---|
| The Sharon M Jenkins Liv Trust | -- | -- | |
| Jenkins Arrington R | -- | -- | |
| Jenkins Sharon M | $233,000 | -- | |
| Hamer Gregory A | $234,900 | -- |
Source: Public Records
Mortgage History
| Date | Status | Borrower | Loan Amount |
|---|---|---|---|
| Previous Owner | Jenkins Sharon M | $228,779 | |
| Previous Owner | Hamer Gregory A | $187,900 |
Source: Public Records
Tax History Compared to Growth
Tax History
| Year | Tax Paid | Tax Assessment Tax Assessment Total Assessment is a certain percentage of the fair market value that is determined by local assessors to be the total taxable value of land and additions on the property. | Land | Improvement |
|---|---|---|---|---|
| 2024 | $5,038 | $198,520 | $33,640 | $164,880 |
| 2023 | $4,267 | $174,960 | $31,760 | $143,200 |
| 2022 | $3,349 | $139,200 | $26,880 | $112,320 |
| 2021 | $2,862 | $112,880 | $18,360 | $94,520 |
| 2020 | $2,983 | $112,880 | $18,360 | $94,520 |
| 2019 | $2,467 | $93,720 | $14,720 | $79,000 |
| 2018 | $2,367 | $89,960 | $13,280 | $76,680 |
| 2017 | $2,438 | $91,240 | $13,800 | $77,440 |
| 2016 | $3,923 | $85,200 | $13,480 | $71,720 |
| 2015 | $3,764 | $81,600 | $9,880 | $71,720 |
| 2014 | $3,803 | $81,600 | $9,880 | $71,720 |
| 2013 | -- | $96,200 | $20,000 | $76,200 |
Source: Public Records
Map
Nearby Homes
- 0 Bellevue Dr Unit 10483100
- 6018 Vicksburg Ct
- 2150 Oglesby Bridge Rd SW
- 2301 Mallory Cir Unit 2
- 2206 Crescent Walk
- 2104 Crest Wood Dr
- 1425 Shingle Way
- 1840 Holmsey Cir
- 700 Miami Ct Unit 3
- 1821 Holmes Dr SW
- 180 Watts Lake Rd
- 1765 Elizabeth Ct SW
- 5262 E Shore Dr SW
- 1433 Cotton Trail SW
- 1769 Elizabeth Ct SW
- 1709 Elizabeth Ct SW
- 1740 Elizabeth Ct SW
- 1721 Windsong Dr SW
- 210 Riveredge Way
- 5162 Kurt Ln SW
- 6489 Bellevue Dr SW Unit 6
- 5781 Ambrose Dr SW Unit 6
- 5771 Ambrose Dr SW Unit 6
- 6492 Bellevue Dr SW Unit 6
- 6488 Bellevue Dr SW
- 6461 Bellevue Dr SW
- 6475 Bellevue Dr SW
- 6484 Bellevue Dr SW
- 6496 Bellevue Dr SW Unit 6
- 5760 Ambrose Dr SW Unit 6
- 5780 Ambrose Dr SW Unit 6
- 6457 Bellevue Dr SW
- 6480 Bellevue Dr SW
- 5770 Ambrose Dr SW
- 6500 Bellevue Dr SW Unit 6
- 6505 Bellevue Dr SW
- 6476 Bellevue Dr SW
- 6464 Bellevue Dr SW
- 6468 Bellevue Dr SW Unit 6
- 6472 Bellevue Dr SW Unit 6