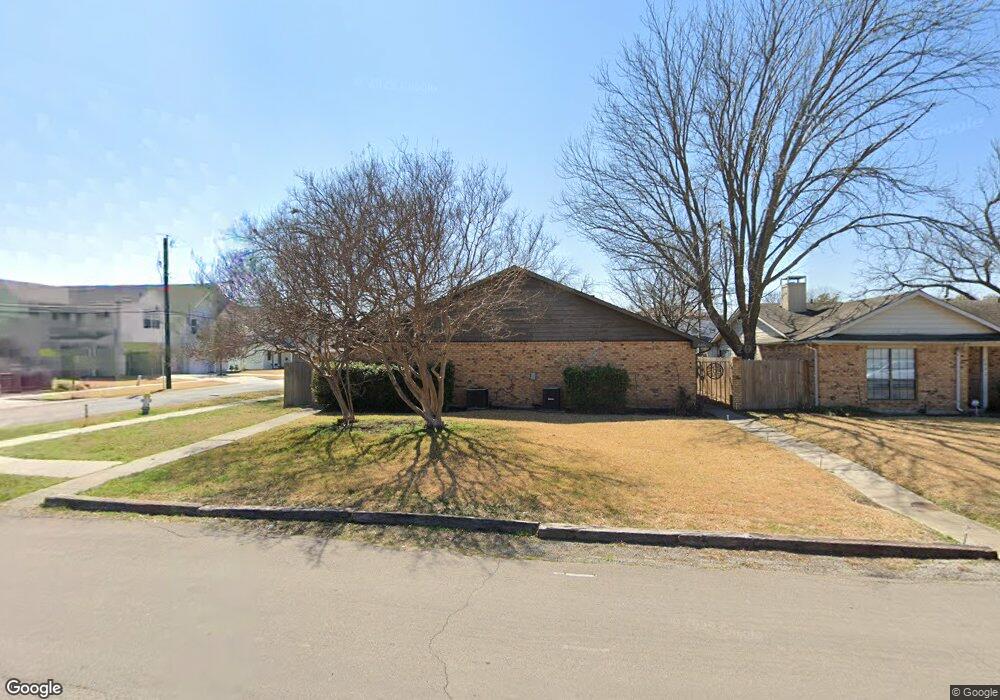
6494 Argo St Unit 6496 Dallas, TX 75214
Northeast Dallas NeighborhoodEstimated Value: $571,000 - $664,000
2
Beds
2
Baths
1,166
Sq Ft
$516/Sq Ft
Est. Value
About This Home
This home is located at 6494 Argo St Unit 6496, Dallas, TX 75214 and is currently estimated at $601,363, approximately $515 per square foot. 6494 Argo St Unit 6496 is a home located in Dallas County with nearby schools including Dan D Rogers Elementary School, Benjamin Franklin International Exploratory Academy, and Hillcrest High School.
Ownership History
Date
Name
Owned For
Owner Type
Purchase Details
Closed on
Apr 22, 2024
Sold by
Yuan Joseph Jing
Bought by
The Mint Capital Inc
Current Estimated Value
Home Financials for this Owner
Home Financials are based on the most recent Mortgage that was taken out on this home.
Original Mortgage
$315,000
Outstanding Balance
$310,002
Interest Rate
6.88%
Mortgage Type
New Conventional
Estimated Equity
$291,361
Purchase Details
Closed on
Apr 19, 2024
Sold by
Slazyk Family Trust and Slazyk Lyneva J
Bought by
Yuan Joseph Jing
Home Financials for this Owner
Home Financials are based on the most recent Mortgage that was taken out on this home.
Original Mortgage
$315,000
Outstanding Balance
$310,002
Interest Rate
6.88%
Mortgage Type
New Conventional
Estimated Equity
$291,361
Purchase Details
Closed on
Jan 26, 2006
Sold by
Korsgaard Brett
Bought by
The Slazyk Living Trust
Create a Home Valuation Report for This Property
The Home Valuation Report is an in-depth analysis detailing your home's value as well as a comparison with similar homes in the area
Home Values in the Area
Average Home Value in this Area
Purchase History
| Date | Buyer | Sale Price | Title Company |
|---|---|---|---|
| The Mint Capital Inc | -- | None Listed On Document | |
| Yuan Joseph Jing | -- | None Listed On Document | |
| The Slazyk Living Trust | -- | None Available |
Source: Public Records
Mortgage History
| Date | Status | Borrower | Loan Amount |
|---|---|---|---|
| Open | Yuan Joseph Jing | $315,000 |
Source: Public Records
Tax History Compared to Growth
Tax History
| Year | Tax Paid | Tax Assessment Tax Assessment Total Assessment is a certain percentage of the fair market value that is determined by local assessors to be the total taxable value of land and additions on the property. | Land | Improvement |
|---|---|---|---|---|
| 2025 | $9,721 | $596,160 | $481,750 | $114,410 |
| 2024 | $9,721 | $434,940 | $240,000 | $194,940 |
| 2023 | $9,721 | $425,000 | $240,000 | $185,000 |
| 2022 | $10,627 | $425,000 | $240,000 | $185,000 |
| 2021 | $9,761 | $370,000 | $240,000 | $130,000 |
| 2020 | $10,038 | $370,000 | $240,000 | $130,000 |
| 2019 | $10,025 | $352,340 | $240,000 | $112,340 |
| 2018 | $9,581 | $352,340 | $240,000 | $112,340 |
| 2017 | $7,535 | $277,080 | $180,000 | $97,080 |
| 2016 | $6,454 | $237,340 | $135,000 | $102,340 |
| 2015 | $5,610 | $222,140 | $85,000 | $137,140 |
| 2014 | $5,610 | $204,530 | $50,000 | $154,530 |
Source: Public Records
Map
Nearby Homes
- 6546 E Lovers Ln
- 6646 E Lovers Ln Unit 602
- 6646 E Lovers Ln Unit 808
- 6646 E Lovers Ln Unit 501
- 6646 E Lovers Ln Unit 702
- 6646 E Lovers Ln Unit 301
- 6646 E Lovers Ln Unit 1308
- 6646 E Lovers Ln Unit 1201
- 6611 Highgate Ln
- 6717 Pimlico Dr
- 6754 E Northwest Hwy
- 6742 E Northwest Hwy
- 6517 Highgate Ln
- 6772 E Northwest Hwy
- 6108 Abrams Rd Unit 613F
- 6108 Abrams Rd Unit 223B
- 6108 Abrams Rd Unit 601F
- 6108 Abrams Rd Unit 216B
- 6108 Abrams Rd Unit 512E
- 6108 Abrams Rd Unit 627F
- 6494 Argo St
- 6490 Argo St
- 6492 Argo St
- 6486 Argo St
- 6497 Lontos Dr
- 6542 E Lovers Ln
- 6554 E Lovers Ln
- 6495 Lontos Dr
- 6493 Lontos Dr
- 6550 E Lovers Ln
- 6538 E Lovers Ln
- 6499 Lontos Dr
- 6480 Argo St
- 6472 Argo St
- 6558 E Lovers Ln
- 6482 Argo St
- 6540 E Lovers Ln
- 6489 Lontos Dr
- 6567 Arborist Ln
- 6562 E Lovers Ln