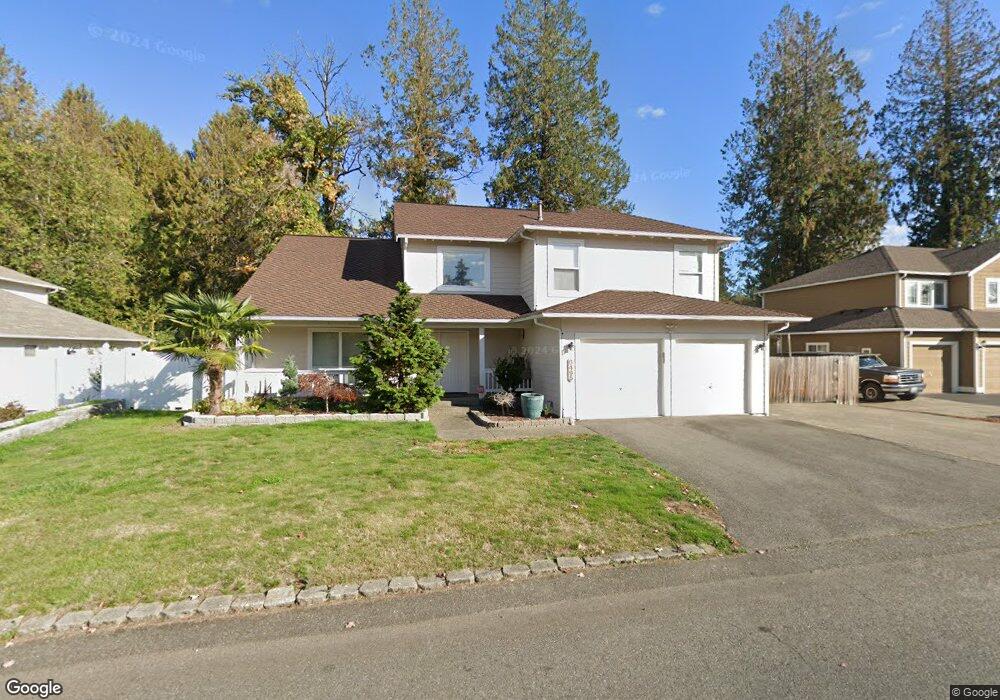
6495 Grand Pine Loop NE Bremerton, WA 98311
Estimated Value: $590,000 - $644,000
4
Beds
3
Baths
2,426
Sq Ft
$252/Sq Ft
Est. Value
About This Home
This home is located at 6495 Grand Pine Loop NE, Bremerton, WA 98311 and is currently estimated at $611,801, approximately $252 per square foot. 6495 Grand Pine Loop NE is a home located in Kitsap County with nearby schools including Woodlands Elementary School, Fairview Middle School, and Olympic High School.
Ownership History
Date
Name
Owned For
Owner Type
Purchase Details
Closed on
Feb 14, 2011
Sold by
Sandall Eric B and Sandall Janet R
Bought by
Ramirez Cris Perez and Ramirez Merla A
Current Estimated Value
Home Financials for this Owner
Home Financials are based on the most recent Mortgage that was taken out on this home.
Original Mortgage
$309,000
Outstanding Balance
$211,040
Interest Rate
4.74%
Mortgage Type
VA
Estimated Equity
$400,761
Purchase Details
Closed on
Jan 6, 2009
Sold by
Rice Wesley E and Rice Letecia C
Bought by
Sandall Eric B and Sandall Janet R
Purchase Details
Closed on
Dec 27, 1996
Sold by
Chaffey Corp
Bought by
Rice Wesley E and Rice Letecia C
Home Financials for this Owner
Home Financials are based on the most recent Mortgage that was taken out on this home.
Original Mortgage
$196,860
Interest Rate
7.53%
Mortgage Type
VA
Create a Home Valuation Report for This Property
The Home Valuation Report is an in-depth analysis detailing your home's value as well as a comparison with similar homes in the area
Home Values in the Area
Average Home Value in this Area
Purchase History
| Date | Buyer | Sale Price | Title Company |
|---|---|---|---|
| Ramirez Cris Perez | $309,280 | Fidelity Ntl Kitsap County | |
| Sandall Eric B | $198,341 | Accommodation | |
| Rice Wesley E | $193,000 | Land Title Company |
Source: Public Records
Mortgage History
| Date | Status | Borrower | Loan Amount |
|---|---|---|---|
| Open | Ramirez Cris Perez | $309,000 | |
| Previous Owner | Rice Wesley E | $196,860 |
Source: Public Records
Tax History Compared to Growth
Tax History
| Year | Tax Paid | Tax Assessment Tax Assessment Total Assessment is a certain percentage of the fair market value that is determined by local assessors to be the total taxable value of land and additions on the property. | Land | Improvement |
|---|---|---|---|---|
| 2026 | $5,318 | $565,840 | $102,280 | $463,560 |
| 2025 | $5,318 | $565,840 | $102,280 | $463,560 |
| 2024 | $5,173 | $565,840 | $102,280 | $463,560 |
| 2023 | $5,192 | $565,840 | $102,280 | $463,560 |
| 2022 | $4,889 | $469,180 | $84,530 | $384,650 |
| 2021 | $4,922 | $449,690 | $62,480 | $387,210 |
| 2020 | $4,597 | $424,890 | $58,960 | $365,930 |
| 2019 | $4,339 | $387,980 | $53,240 | $334,740 |
| 2018 | $4,677 | $324,660 | $44,000 | $280,660 |
| 2017 | $4,160 | $324,660 | $44,000 | $280,660 |
| 2016 | $4,043 | $291,630 | $39,290 | $252,340 |
| 2015 | $3,925 | $295,450 | $43,520 | $251,930 |
| 2014 | -- | $279,710 | $43,520 | $236,190 |
| 2013 | -- | $279,710 | $43,520 | $236,190 |
Source: Public Records
Map
Nearby Homes
- 6398 Juanita Cir NE
- 6630 NE Aquarius Ln
- 425 NE Saturn Ln
- 6347 Hamma Ln NE
- 6530 Newaukum Place NE
- 404 NE Saturn Ln
- 6748 Scorpio Ln NE
- 156 NE Zodiac Ln
- 535 NE Saturn Ln
- 6441 Holland Rd NW
- 940 Yoder Ln NE
- 6190 Holland Rd NW
- 760 NE Woods Ct
- 344 NE Shadowhawk Ln
- 330 NE Shadowhawk Ln
- 750 NE Woods Ct
- 204 NE Shadowhawk Ln
- 228 NE Shadowhawk Ln
- 192 NE Shadowhawk Ln
- 216 NE Shadowhawk Ln
- 6489 Grand Pine Loop NE
- 6501 Grand Pine Loop NE
- 6490 Grand Pine Loop NE
- 6483 Grand Pine Loop NE
- 6507 Grand Pine Loop NE
- 6502 Grand Pine Loop NE
- 6484 Grand Pine Loop NE
- 6508 Grand Pine Loop NE
- 6418 Grand Pine Loop NE
- 6477 Grand Pine Loop NE
- 6424 Grand Pine Loop NE
- 6513 Grand Pine Loop NE
- 6421 Yorktown Place NE Unit 1
- 6412 Grand Pine Loop NE
- 6430 Grand Pine Loop NE
- 6453 Hornet Cir NE Unit 5
- 6437 Hornet Cir NE
- 6445 Hornet Cir NE
- 6429 Yorktown Place NE Unit 2
- 6442 Grand Pine Loop NE