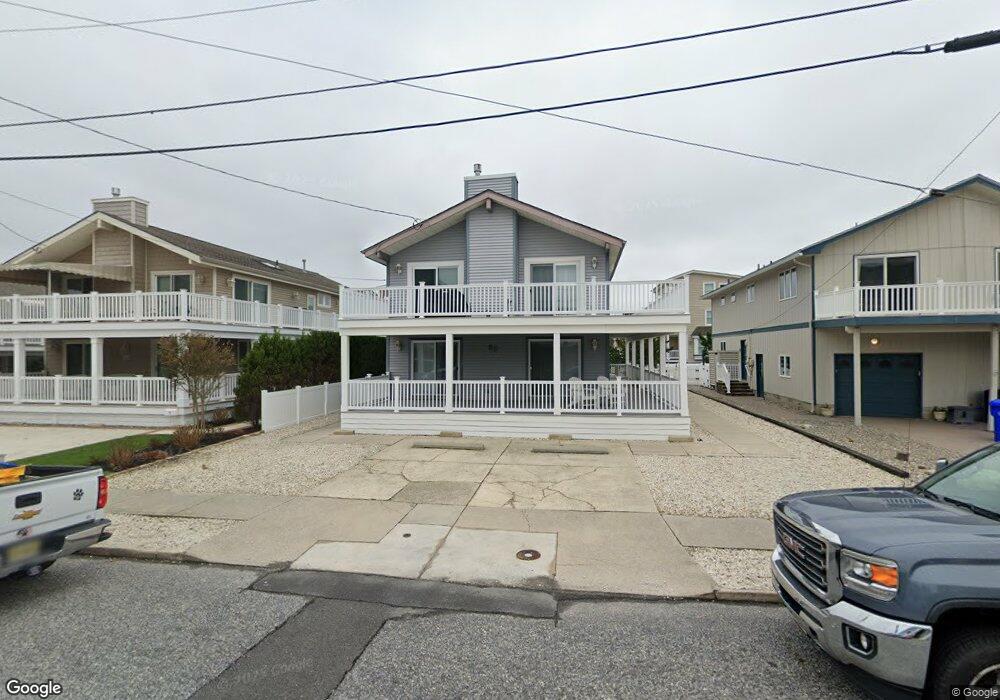
65 23rd St E Avalon, NJ 08202
Estimated Value: $3,421,629 - $5,089,000
Studio
--
Bath
2,392
Sq Ft
$1,805/Sq Ft
Est. Value
About This Home
This home is located at 65 23rd St E, Avalon, NJ 08202 and is currently estimated at $4,318,407, approximately $1,805 per square foot. 65 23rd St E is a home located in Cape May County with nearby schools including Avalon Elementary School.
Ownership History
Date
Name
Owned For
Owner Type
Purchase Details
Closed on
Sep 8, 2014
Sold by
Huntoon Charles W and Huntoon Elaine J
Bought by
Moore Richard and Moore Karin
Current Estimated Value
Home Financials for this Owner
Home Financials are based on the most recent Mortgage that was taken out on this home.
Original Mortgage
$1,406,250
Outstanding Balance
$1,075,781
Interest Rate
4.12%
Mortgage Type
New Conventional
Estimated Equity
$3,242,626
Purchase Details
Closed on
Jan 3, 2001
Sold by
Julius A Fino Estate
Bought by
Huntoon Charles W and Huntoon Elaine J
Home Financials for this Owner
Home Financials are based on the most recent Mortgage that was taken out on this home.
Original Mortgage
$660,000
Interest Rate
7.39%
Create a Home Valuation Report for This Property
The Home Valuation Report is an in-depth analysis detailing your home's value as well as a comparison with similar homes in the area
Home Values in the Area
Average Home Value in this Area
Purchase History
| Date | Buyer | Sale Price | Title Company |
|---|---|---|---|
| Moore Richard | $1,875,000 | Seaboard Title Agency | |
| Huntoon Charles W | $1,000,000 | -- |
Source: Public Records
Mortgage History
| Date | Status | Borrower | Loan Amount |
|---|---|---|---|
| Open | Moore Richard | $1,406,250 | |
| Previous Owner | Huntoon Charles W | $660,000 |
Source: Public Records
Tax History
| Year | Tax Paid | Tax Assessment Tax Assessment Total Assessment is a certain percentage of the fair market value that is determined by local assessors to be the total taxable value of land and additions on the property. | Land | Improvement |
|---|---|---|---|---|
| 2025 | $14,086 | $2,294,200 | $2,000,000 | $294,200 |
| 2024 | $14,086 | $2,294,200 | $2,000,000 | $294,200 |
| 2023 | $13,972 | $2,294,200 | $2,000,000 | $294,200 |
| 2022 | $13,031 | $2,294,200 | $2,000,000 | $294,200 |
| 2021 | $12,549 | $2,294,200 | $2,000,000 | $294,200 |
| 2020 | $12,067 | $2,294,200 | $2,000,000 | $294,200 |
| 2019 | $11,700 | $2,294,200 | $2,000,000 | $294,200 |
| 2018 | $11,196 | $2,294,200 | $2,000,000 | $294,200 |
| 2017 | $10,374 | $1,865,900 | $1,600,000 | $265,900 |
| 2016 | $10,262 | $1,865,900 | $1,600,000 | $265,900 |
| 2015 | $10,095 | $1,835,300 | $1,600,000 | $235,300 |
| 2014 | $9,819 | $1,835,300 | $1,600,000 | $235,300 |
Source: Public Records
Map
Nearby Homes
Your Personal Tour Guide
Ask me questions while you tour the home.