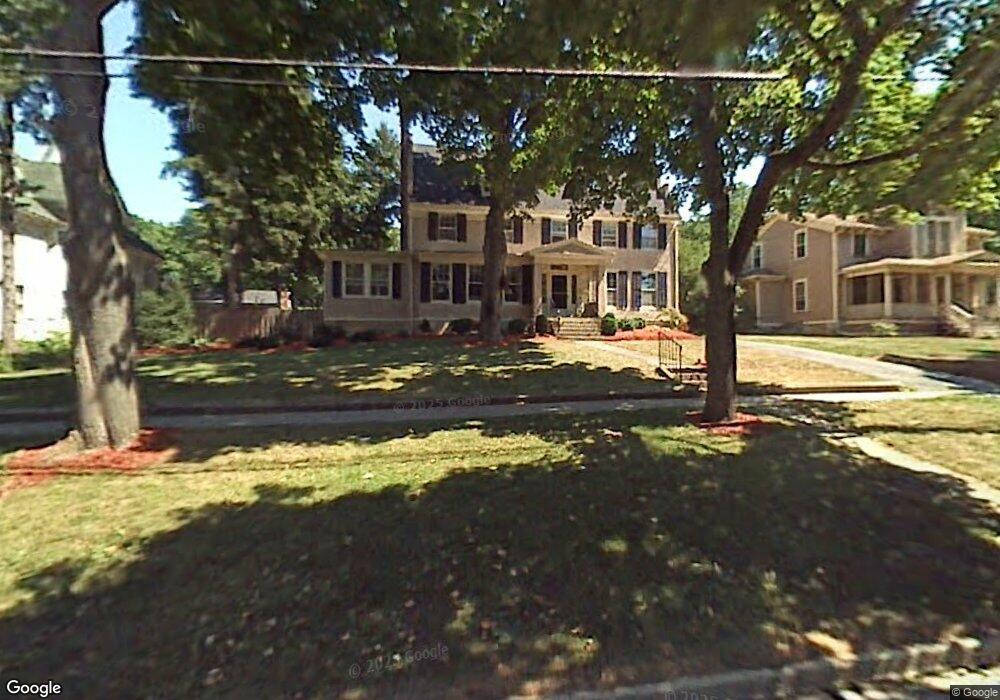
65 2nd St Geneseo, NY 14454
Estimated Value: $433,309 - $589,000
6
Beds
4
Baths
3,977
Sq Ft
$123/Sq Ft
Est. Value
About This Home
This home is located at 65 2nd St, Geneseo, NY 14454 and is currently estimated at $490,077, approximately $123 per square foot. 65 2nd St is a home located in Livingston County with nearby schools including Geneseo Elementary School, Geneseo Middle/High School, and Genesee Country Christian School.
Ownership History
Date
Name
Owned For
Owner Type
Purchase Details
Closed on
Aug 2, 2013
Sold by
Linfoot John
Bought by
Linfoot John
Current Estimated Value
Purchase Details
Closed on
May 21, 2013
Sold by
Linfoot John
Bought by
Linfoot John
Purchase Details
Closed on
Sep 26, 2005
Sold by
Linfoot John
Bought by
Linfoot John
Purchase Details
Closed on
Jun 7, 2004
Purchase Details
Closed on
Sep 1, 1999
Sold by
Biehn Davie P
Bought by
Linfoot John P
Create a Home Valuation Report for This Property
The Home Valuation Report is an in-depth analysis detailing your home's value as well as a comparison with similar homes in the area
Home Values in the Area
Average Home Value in this Area
Purchase History
| Date | Buyer | Sale Price | Title Company |
|---|---|---|---|
| Linfoot John | -- | -- | |
| Linfoot John | -- | -- | |
| Linfoot John | -- | -- | |
| -- | -- | -- | |
| Linfoot John P | $260,000 | Jon H Porter |
Source: Public Records
Tax History
| Year | Tax Paid | Tax Assessment Tax Assessment Total Assessment is a certain percentage of the fair market value that is determined by local assessors to be the total taxable value of land and additions on the property. | Land | Improvement |
|---|---|---|---|---|
| 2025 | $10,208 | $333,900 | $41,400 | $292,500 |
| 2024 | $10,017 | $333,900 | $41,400 | $292,500 |
| 2023 | $9,712 | $333,900 | $41,400 | $292,500 |
| 2022 | $9,573 | $333,900 | $41,400 | $292,500 |
| 2021 | $9,688 | $301,000 | $37,300 | $263,700 |
| 2020 | $9,454 | $301,000 | $37,300 | $263,700 |
| 2019 | $9,295 | $301,000 | $37,300 | $263,700 |
| 2018 | $9,295 | $301,000 | $37,300 | $263,700 |
| 2017 | $9,875 | $300,600 | $34,700 | $265,900 |
| 2016 | $9,670 | $300,600 | $34,700 | $265,900 |
| 2015 | -- | $300,600 | $34,700 | $265,900 |
| 2014 | -- | $300,600 | $34,700 | $265,900 |
Source: Public Records
Map
Nearby Homes
- 66 2nd St
- 72 2nd St
- 24 Elm St
- 17 South St
- 67 Center St
- 38 Westview Crescent
- 12 Cavalry Rd
- 0 Volunteer Rd Unit R1658263
- 4528 North Rd
- 4498 Lima Rd
- 4583 Lima Rd
- 2893 Cuylerville Rd
- 4002 North Rd
- 0 North Rd
- 4540 York Rd
- 5270 Wheelock Rd
- 5279 Mount Morris Rd
- 5502 Mount Morris Rd
- 5502 Mount Morris Rd Lot #1 Rd
- 4601 W Lake Rd
Your Personal Tour Guide
Ask me questions while you tour the home.