Estimated Value: $241,095 - $298,000
3
Beds
1
Bath
1,192
Sq Ft
$225/Sq Ft
Est. Value
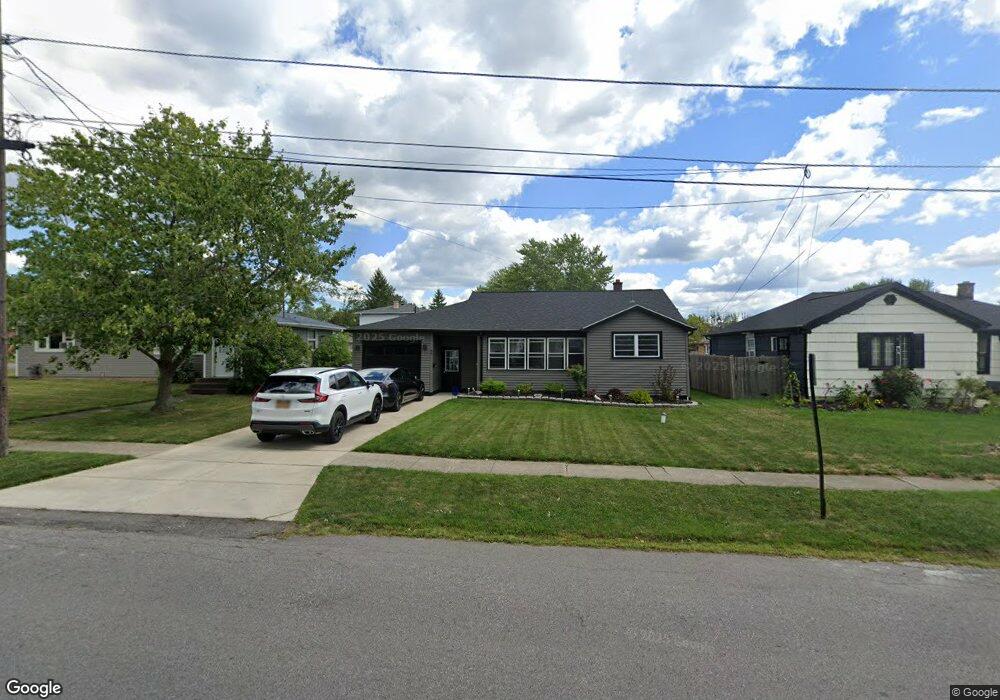
About This Home
This home is located at 65 A St Unit 36, Depew, NY 14043 and is currently estimated at $268,024, approximately $224 per square foot. 65 A St Unit 36 is a home located in Erie County with nearby schools including Cayuga Heights Elementary School, Depew Middle School, and Depew High School.
Ownership History
Date
Name
Owned For
Owner Type
Purchase Details
Closed on
Feb 27, 2020
Sold by
Lubonski Malwina
Bought by
Neill Cory John O and Koestier Kelly Nicole
Current Estimated Value
Home Financials for this Owner
Home Financials are based on the most recent Mortgage that was taken out on this home.
Original Mortgage
$152,950
Outstanding Balance
$135,459
Interest Rate
3.5%
Mortgage Type
New Conventional
Estimated Equity
$132,565
Purchase Details
Closed on
Oct 28, 2019
Sold by
Bank Of New York Mellon Trust Company Na
Bought by
Lubonski Malwina
Purchase Details
Closed on
Jul 1, 2019
Sold by
Zent Patrick A
Bought by
Bank Of New York Mellon Trust Company Na
Create a Home Valuation Report for This Property
The Home Valuation Report is an in-depth analysis detailing your home's value as well as a comparison with similar homes in the area
Home Values in the Area
Average Home Value in this Area
Purchase History
| Date | Buyer | Sale Price | Title Company |
|---|---|---|---|
| Neill Cory John O | $161,000 | None Available | |
| Lubonski Malwina | $63,000 | None Available | |
| Bank Of New York Mellon Trust Company Na | $122,328 | None Available |
Source: Public Records
Mortgage History
| Date | Status | Borrower | Loan Amount |
|---|---|---|---|
| Open | Neill Cory John O | $152,950 |
Source: Public Records
Tax History
| Year | Tax Paid | Tax Assessment Tax Assessment Total Assessment is a certain percentage of the fair market value that is determined by local assessors to be the total taxable value of land and additions on the property. | Land | Improvement |
|---|---|---|---|---|
| 2024 | $6,302 | $161,000 | $15,100 | $145,900 |
| 2023 | $5,858 | $161,000 | $15,100 | $145,900 |
| 2022 | $5,826 | $161,000 | $15,100 | $145,900 |
| 2021 | $4,344 | $149,000 | $15,100 | $133,900 |
| 2020 | $5,115 | $99,600 | $10,200 | $89,400 |
| 2019 | $4,027 | $110,000 | $10,200 | $99,800 |
| 2018 | $5,557 | $110,000 | $10,200 | $99,800 |
| 2017 | $4,027 | $110,000 | $10,200 | $99,800 |
| 2016 | $5,431 | $110,000 | $10,200 | $99,800 |
| 2015 | -- | $110,000 | $10,200 | $99,800 |
| 2014 | -- | $92,900 | $10,200 | $82,700 |
Source: Public Records
Map
Nearby Homes
Your Personal Tour Guide
Ask me questions while you tour the home.