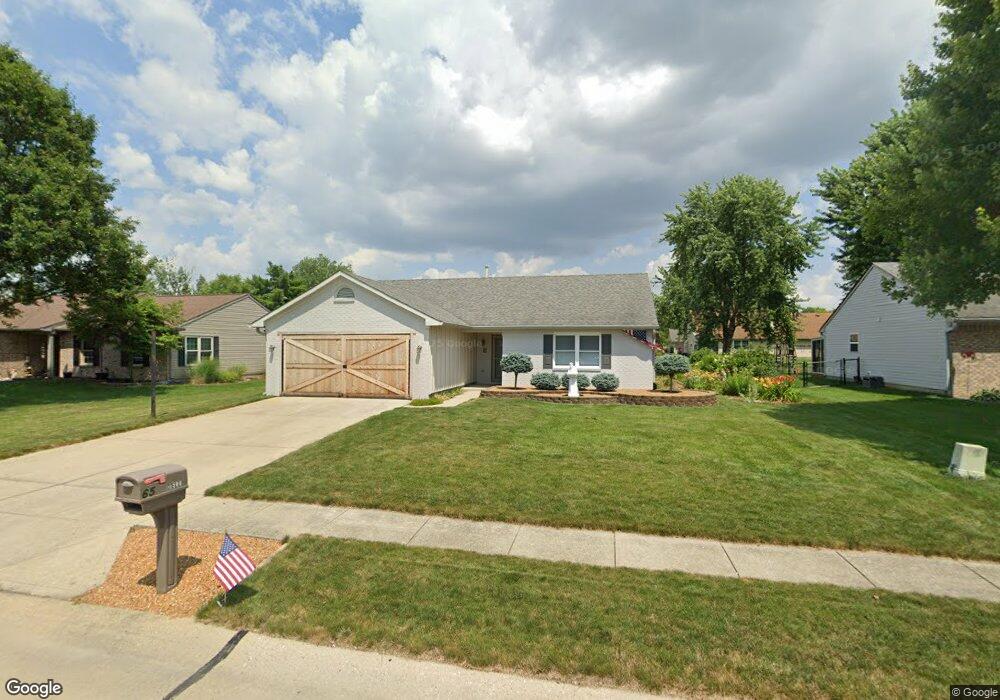
65 Anjuli Ct Whiteland, IN 46184
Estimated Value: $244,000 - $264,000
3
Beds
2
Baths
1,252
Sq Ft
$203/Sq Ft
Est. Value
About This Home
This home is located at 65 Anjuli Ct, Whiteland, IN 46184 and is currently estimated at $254,572, approximately $203 per square foot. 65 Anjuli Ct is a home located in Johnson County with nearby schools including Break-O-Day Elementary School, Clark-Pleasant Middle School, and Whiteland Community High School.
Ownership History
Date
Name
Owned For
Owner Type
Purchase Details
Closed on
Jun 26, 2009
Sold by
Swanson Robert
Bought by
Dell John R
Current Estimated Value
Home Financials for this Owner
Home Financials are based on the most recent Mortgage that was taken out on this home.
Original Mortgage
$104,500
Outstanding Balance
$66,909
Interest Rate
4.94%
Mortgage Type
VA
Estimated Equity
$187,663
Purchase Details
Closed on
Jul 5, 2005
Sold by
Eilert Jenna C and Workman Janna C
Bought by
Swanson Robert
Home Financials for this Owner
Home Financials are based on the most recent Mortgage that was taken out on this home.
Original Mortgage
$88,400
Interest Rate
5.68%
Mortgage Type
New Conventional
Create a Home Valuation Report for This Property
The Home Valuation Report is an in-depth analysis detailing your home's value as well as a comparison with similar homes in the area
Home Values in the Area
Average Home Value in this Area
Purchase History
| Date | Buyer | Sale Price | Title Company |
|---|---|---|---|
| Dell John R | -- | First American Title Insuran | |
| Swanson Robert | -- | None Available |
Source: Public Records
Mortgage History
| Date | Status | Borrower | Loan Amount |
|---|---|---|---|
| Open | Dell John R | $104,500 | |
| Previous Owner | Swanson Robert | $88,400 |
Source: Public Records
Tax History Compared to Growth
Tax History
| Year | Tax Paid | Tax Assessment Tax Assessment Total Assessment is a certain percentage of the fair market value that is determined by local assessors to be the total taxable value of land and additions on the property. | Land | Improvement |
|---|---|---|---|---|
| 2025 | $1,248 | $226,700 | $51,000 | $175,700 |
| 2024 | $1,248 | $204,000 | $51,000 | $153,000 |
| 2023 | $1,188 | $197,600 | $51,000 | $146,600 |
| 2022 | $1,068 | $175,800 | $32,000 | $143,800 |
| 2021 | $529 | $140,500 | $32,000 | $108,500 |
| 2020 | $344 | $128,300 | $26,400 | $101,900 |
| 2019 | $331 | $125,000 | $26,400 | $98,600 |
| 2018 | $143 | $114,400 | $16,700 | $97,700 |
| 2017 | $10 | $100,700 | $16,700 | $84,000 |
| 2016 | $1,008 | $100,700 | $16,700 | $84,000 |
| 2014 | $1,018 | $101,100 | $16,700 | $84,400 |
| 2013 | $1,018 | $102,900 | $16,700 | $86,200 |
Source: Public Records
Map
Nearby Homes
- 12 Rypma Row
- 647 Bluestem Cir
- Liberty Plan at Crossroads at Southport
- 7331 Deerberg Dr
- Jefferson Plan at Crossroads at Southport
- 7338 Deerberg Dr
- Rushmore Plan at Crossroads at Southport
- Lincoln Plan at Crossroads at Southport
- Washington Plan at Crossroads at Southport
- 346 Switchgrass Ln
- 821 Princeton Dr
- 731 W 600 N
- 230 Parkview Dr
- 239 Shelton Place
- 143 Tracy Ridge Blvd
- 250 Southlane Dr
- 0 E 700 N Unit MBR22036500
- 135 Bradford Place
- 34 Crestwood Dr
- 106 Tracy Ridge Blvd