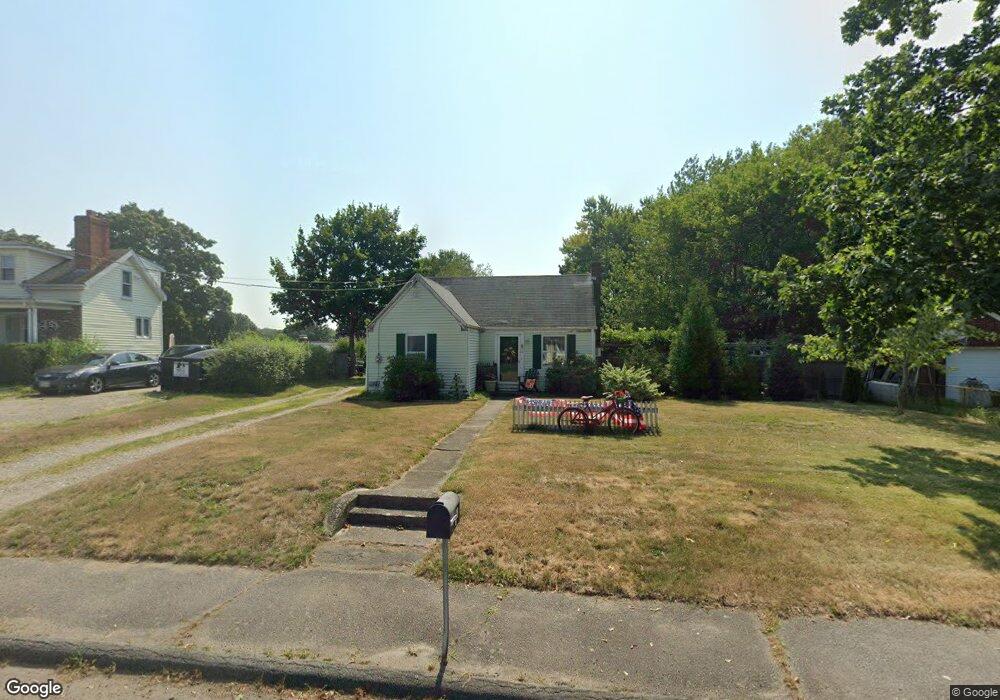
65 Anthony St Seekonk, MA 02771
Monroes-South Seekonk NeighborhoodEstimated Value: $460,848 - $476,000
2
Beds
2
Baths
1,332
Sq Ft
$350/Sq Ft
Est. Value
About This Home
This home is located at 65 Anthony St, Seekonk, MA 02771 and is currently estimated at $466,462, approximately $350 per square foot. 65 Anthony St is a home located in Bristol County with nearby schools including Seekonk High School, St Mary Academy-Bay View, and Providence Country Day School.
Ownership History
Date
Name
Owned For
Owner Type
Purchase Details
Closed on
Mar 28, 1989
Sold by
Hoch Bruce T
Bought by
Berg Wm A
Current Estimated Value
Home Financials for this Owner
Home Financials are based on the most recent Mortgage that was taken out on this home.
Original Mortgage
$108,000
Interest Rate
10.49%
Mortgage Type
Purchase Money Mortgage
Create a Home Valuation Report for This Property
The Home Valuation Report is an in-depth analysis detailing your home's value as well as a comparison with similar homes in the area
Home Values in the Area
Average Home Value in this Area
Purchase History
| Date | Buyer | Sale Price | Title Company |
|---|---|---|---|
| Berg Wm A | $120,000 | -- |
Source: Public Records
Mortgage History
| Date | Status | Borrower | Loan Amount |
|---|---|---|---|
| Open | Berg Wm A | $105,000 | |
| Closed | Berg Wm A | $108,000 |
Source: Public Records
Tax History
| Year | Tax Paid | Tax Assessment Tax Assessment Total Assessment is a certain percentage of the fair market value that is determined by local assessors to be the total taxable value of land and additions on the property. | Land | Improvement |
|---|---|---|---|---|
| 2025 | $4,327 | $350,400 | $178,600 | $171,800 |
| 2024 | $4,182 | $338,600 | $178,600 | $160,000 |
| 2023 | $3,869 | $295,100 | $152,100 | $143,000 |
| 2022 | $3,582 | $268,500 | $146,000 | $122,500 |
| 2021 | $3,375 | $248,700 | $128,100 | $120,600 |
| 2020 | $3,196 | $242,700 | $128,500 | $114,200 |
| 2019 | $3,018 | $231,100 | $122,500 | $108,600 |
| 2018 | $2,949 | $220,900 | $119,200 | $101,700 |
| 2017 | $2,847 | $211,500 | $116,200 | $95,300 |
| 2016 | $2,809 | $209,500 | $116,200 | $93,300 |
| 2015 | $2,739 | $207,000 | $116,200 | $90,800 |
Source: Public Records
Map
Nearby Homes
- 11 Hawthorne Dr
- 57 Mohawk Dr
- 7 Jill Ct
- 454 Fall River Ave
- 0 N Wheaton Ave
- 155 Sagamore Rd
- 85 Hospital Rd
- 30 Fuller St
- 8 Agawam Ct
- 34 Palmer River Rd
- 100 Bradley St
- 0 Pinetop Rd
- 3 Pine Top Rd
- 195 Barney Ave
- 6 Hazelton Rd
- 1741 Wampanoag Trail
- 0 Wheaton Ave
- 15 George w Finnerty Rd
- 34 Commack Rd
- 203 Providence St Bldr Lot 5
Your Personal Tour Guide
Ask me questions while you tour the home.