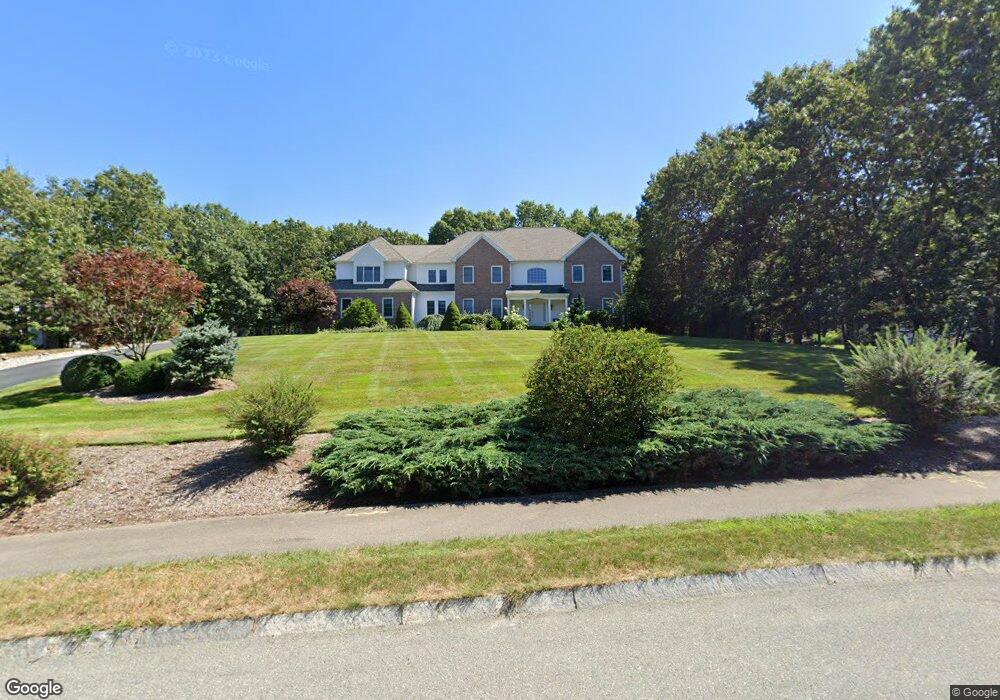
65 Aspen Rd Sharon, MA 02067
Estimated Value: $1,683,674 - $1,853,000
5
Beds
5
Baths
4,806
Sq Ft
$369/Sq Ft
Est. Value
About This Home
This home is located at 65 Aspen Rd, Sharon, MA 02067 and is currently estimated at $1,771,169, approximately $368 per square foot. 65 Aspen Rd is a home located in Norfolk County with nearby schools including East Elementary School, Sharon Middle School, and Sharon High School.
Ownership History
Date
Name
Owned For
Owner Type
Purchase Details
Closed on
Jan 5, 2005
Sold by
Aspen 17 Inc
Bought by
Yacoub Tamer
Current Estimated Value
Home Financials for this Owner
Home Financials are based on the most recent Mortgage that was taken out on this home.
Original Mortgage
$196,550
Outstanding Balance
$99,235
Interest Rate
5.75%
Estimated Equity
$1,671,934
Purchase Details
Closed on
Sep 12, 2003
Sold by
Goodheart Llc
Bought by
Urmila Rt
Create a Home Valuation Report for This Property
The Home Valuation Report is an in-depth analysis detailing your home's value as well as a comparison with similar homes in the area
Home Values in the Area
Average Home Value in this Area
Purchase History
| Date | Buyer | Sale Price | Title Company |
|---|---|---|---|
| Yacoub Tamer | $1,311,000 | -- | |
| Aspen Seventeen Inc | -- | -- | |
| Urmila Rt | $325,000 | -- |
Source: Public Records
Mortgage History
| Date | Status | Borrower | Loan Amount |
|---|---|---|---|
| Open | Aspen Seventeen Inc | $196,550 | |
| Open | Aspen Seventeen Inc | $983,250 |
Source: Public Records
Tax History Compared to Growth
Tax History
| Year | Tax Paid | Tax Assessment Tax Assessment Total Assessment is a certain percentage of the fair market value that is determined by local assessors to be the total taxable value of land and additions on the property. | Land | Improvement |
|---|---|---|---|---|
| 2025 | $26,806 | $1,533,500 | $529,000 | $1,004,500 |
| 2024 | $26,048 | $1,481,700 | $485,400 | $996,300 |
| 2023 | $24,249 | $1,304,400 | $453,800 | $850,600 |
| 2022 | $23,508 | $1,190,300 | $378,100 | $812,200 |
| 2021 | $23,407 | $1,145,700 | $356,500 | $789,200 |
| 2020 | $22,310 | $1,174,200 | $385,000 | $789,200 |
| 2019 | $22,469 | $1,157,600 | $368,400 | $789,200 |
| 2018 | $22,285 | $1,150,500 | $361,300 | $789,200 |
| 2017 | $22,114 | $1,127,100 | $337,900 | $789,200 |
| 2016 | $21,274 | $1,057,900 | $337,900 | $720,000 |
| 2015 | $21,077 | $1,038,300 | $299,200 | $739,100 |
| 2014 | $19,200 | $934,300 | $254,700 | $679,600 |
Source: Public Records
Map
Nearby Homes