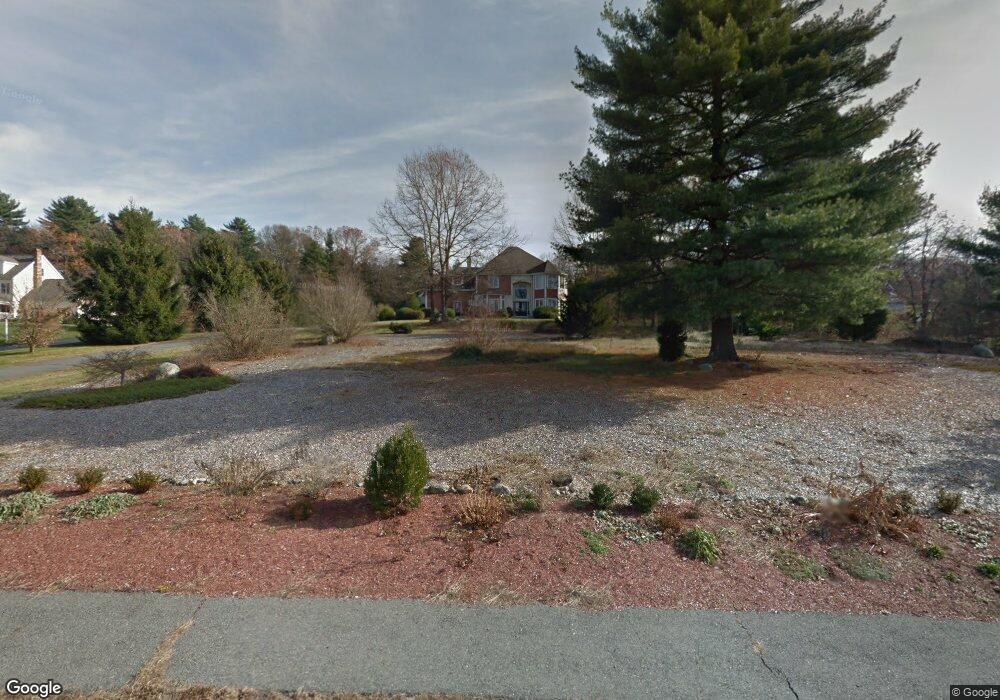
65 Autumn Rd Wrentham, MA 02093
West Wrentham NeighborhoodEstimated Value: $1,042,533 - $1,829,000
4
Beds
3
Baths
3,717
Sq Ft
$354/Sq Ft
Est. Value
About This Home
This home is located at 65 Autumn Rd, Wrentham, MA 02093 and is currently estimated at $1,316,133, approximately $354 per square foot. 65 Autumn Rd is a home located in Norfolk County with nearby schools including Delaney Elementary School, Charles E Roderick, and Mercymount Country Day School.
Ownership History
Date
Name
Owned For
Owner Type
Purchase Details
Closed on
Jun 28, 1991
Sold by
Pare Irene
Bought by
Mcnamara Leo S and Mcnamara Cheryl A
Current Estimated Value
Home Financials for this Owner
Home Financials are based on the most recent Mortgage that was taken out on this home.
Original Mortgage
$191,000
Interest Rate
9.44%
Mortgage Type
Purchase Money Mortgage
Create a Home Valuation Report for This Property
The Home Valuation Report is an in-depth analysis detailing your home's value as well as a comparison with similar homes in the area
Home Values in the Area
Average Home Value in this Area
Purchase History
| Date | Buyer | Sale Price | Title Company |
|---|---|---|---|
| Mcnamara Leo S | $335,000 | -- |
Source: Public Records
Mortgage History
| Date | Status | Borrower | Loan Amount |
|---|---|---|---|
| Closed | Mcnamara Leo S | $165,000 | |
| Closed | Mcnamara Leo S | $191,000 |
Source: Public Records
Tax History
| Year | Tax Paid | Tax Assessment Tax Assessment Total Assessment is a certain percentage of the fair market value that is determined by local assessors to be the total taxable value of land and additions on the property. | Land | Improvement |
|---|---|---|---|---|
| 2025 | $10,666 | $920,300 | $288,200 | $632,100 |
| 2024 | $10,240 | $853,300 | $288,200 | $565,100 |
| 2023 | $10,169 | $805,800 | $262,100 | $543,700 |
| 2022 | $10,012 | $732,400 | $255,300 | $477,100 |
| 2021 | $9,483 | $674,000 | $238,600 | $435,400 |
| 2020 | $9,713 | $681,600 | $182,200 | $499,400 |
| 2019 | $9,304 | $658,900 | $182,200 | $476,700 |
| 2018 | $9,726 | $683,000 | $182,000 | $501,000 |
| 2017 | $9,569 | $671,500 | $178,500 | $493,000 |
| 2016 | $9,379 | $656,800 | $173,300 | $483,500 |
| 2015 | $9,505 | $634,500 | $166,600 | $467,900 |
| 2014 | $9,508 | $621,000 | $160,300 | $460,700 |
Source: Public Records
Map
Nearby Homes
- 10 Follett Dr
- 1620 West St
- 60 Grant Ave
- 2095 West St
- 1565 West St
- 9 Reagan Ave
- 25 Nature View Dr
- 172 Pine Swamp Rd
- 180 Pine Swamp Rd
- 56 Pine Swamp Rd
- 365 W Wrentham Rd
- 20 Nature View Dr
- 925 Washington St
- 9 Pebble Cir Unit 9
- 1 Spring St
- 47 Austin Dr
- 65 Palmetto Dr Unit 65
- 9 Brookfield Ln
- 21 Palmetto Dr Unit 21
- 24 Palmetto Dr Unit 24
Your Personal Tour Guide
Ask me questions while you tour the home.