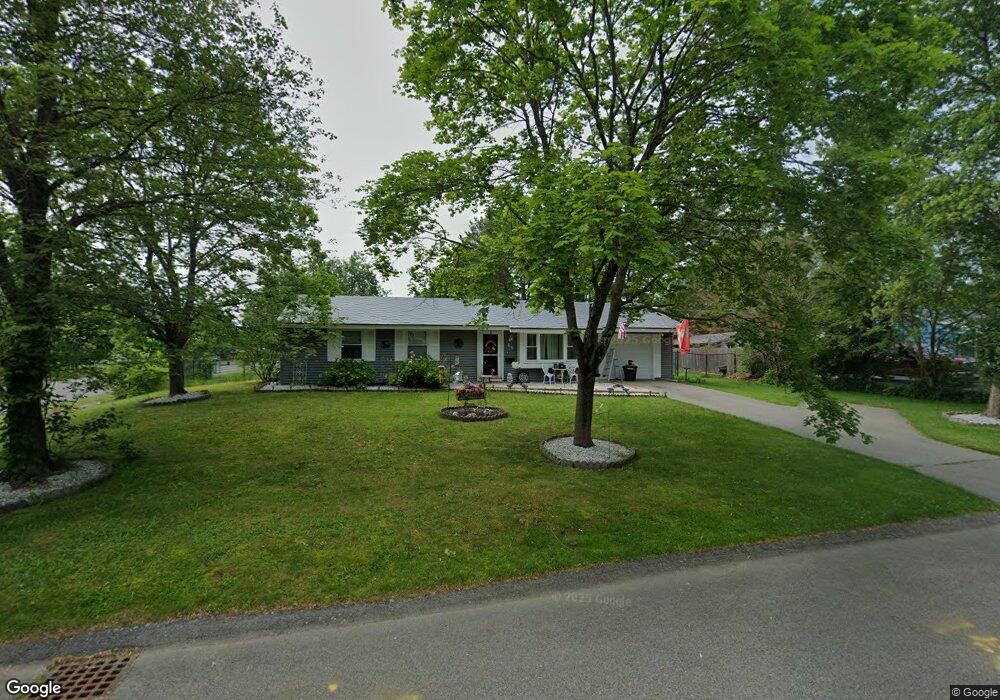
65 Backlund Dr Brockton, MA 02302
Estimated Value: $440,000 - $472,030
3
Beds
1
Bath
1,008
Sq Ft
$453/Sq Ft
Est. Value
About This Home
This home is located at 65 Backlund Dr, Brockton, MA 02302 and is currently estimated at $456,758, approximately $453 per square foot. 65 Backlund Dr is a home located in Plymouth County with nearby schools including Davis K-8 School, John F. Kennedy Elementary School, and South Middle School.
Ownership History
Date
Name
Owned For
Owner Type
Purchase Details
Closed on
May 12, 2023
Sold by
Muggridge Evelyn M
Bought by
Karen Alicea Irt
Current Estimated Value
Purchase Details
Closed on
Aug 31, 1999
Sold by
Casarano Rosemarie E
Bought by
Muggridge Walter and Muggridge Evelyn
Create a Home Valuation Report for This Property
The Home Valuation Report is an in-depth analysis detailing your home's value as well as a comparison with similar homes in the area
Home Values in the Area
Average Home Value in this Area
Purchase History
| Date | Buyer | Sale Price | Title Company |
|---|---|---|---|
| Karen Alicea Irt | -- | None Available | |
| Muggridge Walter | $116,800 | -- |
Source: Public Records
Mortgage History
| Date | Status | Borrower | Loan Amount |
|---|---|---|---|
| Previous Owner | Muggridge Walter | $185,400 | |
| Previous Owner | Muggridge Walter | $176,000 |
Source: Public Records
Tax History Compared to Growth
Tax History
| Year | Tax Paid | Tax Assessment Tax Assessment Total Assessment is a certain percentage of the fair market value that is determined by local assessors to be the total taxable value of land and additions on the property. | Land | Improvement |
|---|---|---|---|---|
| 2025 | $4,494 | $371,100 | $162,300 | $208,800 |
| 2024 | $4,396 | $365,700 | $162,300 | $203,400 |
| 2023 | $4,209 | $324,300 | $112,700 | $211,600 |
| 2022 | $4,120 | $294,900 | $102,400 | $192,500 |
| 2021 | $3,944 | $272,000 | $95,700 | $176,300 |
| 2020 | $3,962 | $261,500 | $83,700 | $177,800 |
| 2019 | $3,484 | $224,200 | $80,200 | $144,000 |
| 2018 | $3,432 | $213,700 | $80,200 | $133,500 |
| 2017 | $2,858 | $177,500 | $80,200 | $97,300 |
| 2016 | $3,130 | $180,300 | $76,500 | $103,800 |
| 2015 | $3,018 | $166,300 | $76,500 | $89,800 |
| 2014 | $2,977 | $164,200 | $76,500 | $87,700 |
Source: Public Records
Map
Nearby Homes