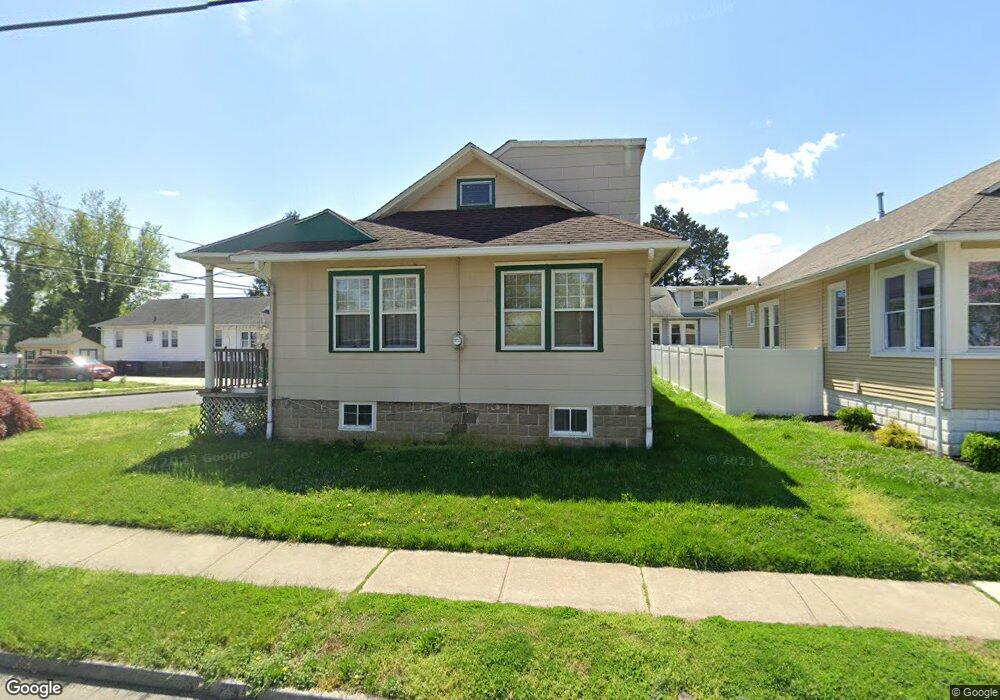
65 Baynes Ave Gloucester City, NJ 08030
Estimated Value: $240,299 - $309,000
--
Bed
--
Bath
1,528
Sq Ft
$186/Sq Ft
Est. Value
About This Home
This home is located at 65 Baynes Ave, Gloucester City, NJ 08030 and is currently estimated at $284,075, approximately $185 per square foot. 65 Baynes Ave is a home located in Camden County with nearby schools including Cold Springs School, Gloucester City Middle School, and Gloucester City Junior/Senior High School.
Ownership History
Date
Name
Owned For
Owner Type
Purchase Details
Closed on
Aug 16, 2002
Sold by
Waldron Edward T
Bought by
John C States
Current Estimated Value
Home Financials for this Owner
Home Financials are based on the most recent Mortgage that was taken out on this home.
Original Mortgage
$57,000
Outstanding Balance
$23,792
Interest Rate
6.36%
Estimated Equity
$260,283
Create a Home Valuation Report for This Property
The Home Valuation Report is an in-depth analysis detailing your home's value as well as a comparison with similar homes in the area
Home Values in the Area
Average Home Value in this Area
Purchase History
| Date | Buyer | Sale Price | Title Company |
|---|---|---|---|
| John C States | $71,300 | -- |
Source: Public Records
Mortgage History
| Date | Status | Borrower | Loan Amount |
|---|---|---|---|
| Open | John C States | $57,000 |
Source: Public Records
Tax History Compared to Growth
Tax History
| Year | Tax Paid | Tax Assessment Tax Assessment Total Assessment is a certain percentage of the fair market value that is determined by local assessors to be the total taxable value of land and additions on the property. | Land | Improvement |
|---|---|---|---|---|
| 2025 | $7,189 | $143,400 | $34,200 | $109,200 |
| 2024 | $7,176 | $143,400 | $34,200 | $109,200 |
| 2023 | $7,176 | $143,400 | $34,200 | $109,200 |
| 2022 | $6,747 | $143,400 | $34,200 | $109,200 |
| 2021 | $6,680 | $143,400 | $34,200 | $109,200 |
| 2020 | $6,450 | $143,400 | $34,200 | $109,200 |
| 2019 | $6,318 | $143,400 | $34,200 | $109,200 |
| 2018 | $6,195 | $143,400 | $34,200 | $109,200 |
| 2017 | $6,067 | $143,400 | $34,200 | $109,200 |
| 2016 | $5,838 | $143,400 | $34,200 | $109,200 |
| 2015 | $5,257 | $143,400 | $34,200 | $109,200 |
| 2014 | $4,790 | $91,300 | $20,500 | $70,800 |
Source: Public Records
Map
Nearby Homes