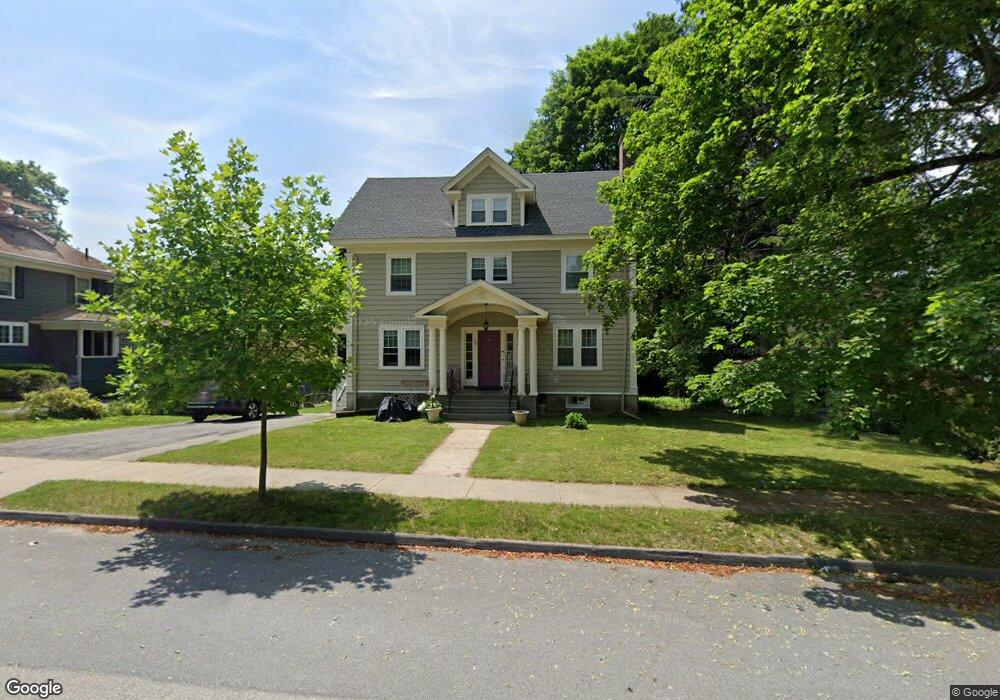
65 Berwick St Worcester, MA 01602
Newton Square NeighborhoodEstimated Value: $555,000 - $641,000
6
Beds
4
Baths
2,370
Sq Ft
$250/Sq Ft
Est. Value
About This Home
This home is located at 65 Berwick St, Worcester, MA 01602 and is currently estimated at $592,973, approximately $250 per square foot. 65 Berwick St is a home located in Worcester County with nearby schools including Chandler Magnet, Jacob Hiatt Magnet School, and Flagg Street School.
Ownership History
Date
Name
Owned For
Owner Type
Purchase Details
Closed on
Sep 21, 2020
Sold by
Georges Peter T
Bought by
Georges Ft
Current Estimated Value
Purchase Details
Closed on
Oct 9, 2019
Sold by
Fhlm
Bought by
Tawafenos-Georges P
Purchase Details
Closed on
Aug 19, 2019
Sold by
Burke Richard F and Tiaa Fsb
Bought by
Fhlm
Purchase Details
Closed on
Jul 30, 1996
Sold by
Sheftel Miriam
Bought by
Burke Richard and Burke Anne
Home Financials for this Owner
Home Financials are based on the most recent Mortgage that was taken out on this home.
Original Mortgage
$100,000
Interest Rate
8.37%
Mortgage Type
Purchase Money Mortgage
Create a Home Valuation Report for This Property
The Home Valuation Report is an in-depth analysis detailing your home's value as well as a comparison with similar homes in the area
Home Values in the Area
Average Home Value in this Area
Purchase History
| Date | Buyer | Sale Price | Title Company |
|---|---|---|---|
| Georges Ft | -- | None Available | |
| Tawafenos-Georges P | $201,000 | -- | |
| Fhlm | $213,200 | -- | |
| Burke Richard | $165,000 | -- |
Source: Public Records
Mortgage History
| Date | Status | Borrower | Loan Amount |
|---|---|---|---|
| Previous Owner | Burke Richard | $31,000 | |
| Previous Owner | Burke Richard | $100,000 |
Source: Public Records
Tax History
| Year | Tax Paid | Tax Assessment Tax Assessment Total Assessment is a certain percentage of the fair market value that is determined by local assessors to be the total taxable value of land and additions on the property. | Land | Improvement |
|---|---|---|---|---|
| 2025 | $6,152 | $466,400 | $124,600 | $341,800 |
| 2024 | $6,024 | $438,100 | $124,600 | $313,500 |
| 2023 | $5,782 | $403,200 | $107,300 | $295,900 |
| 2022 | $5,351 | $351,800 | $85,900 | $265,900 |
| 2021 | $5,197 | $319,200 | $68,800 | $250,400 |
| 2020 | $5,153 | $303,100 | $68,600 | $234,500 |
| 2019 | $5,247 | $291,500 | $66,400 | $225,100 |
| 2018 | $5,204 | $275,200 | $66,400 | $208,800 |
| 2017 | $4,694 | $244,200 | $66,400 | $177,800 |
| 2016 | $4,924 | $238,900 | $56,100 | $182,800 |
| 2015 | $4,795 | $238,900 | $56,100 | $182,800 |
| 2014 | $4,662 | $238,600 | $56,100 | $182,500 |
Source: Public Records
Map
Nearby Homes
- 31 Lenox St
- 19 Kenilworth Rd
- 22 Audubon Rd
- 1029 Pleasant St Unit 19
- 8 Modred Ct
- 18 Merlin Ct Unit 18
- 85 Camelot Dr Unit 118
- 18 Hadwen Ln
- 7 Longworth Rd
- 12 Cardinal Rd
- 16 Sherwood Rd
- 23 Orrison St
- 32 Aylesbury Rd
- 93 Newton Ave N
- 83 Newton Ave N
- 3A Chalmers Rd
- 118 Beaconsfield Rd
- 9 Dennison Rd
- 3 Franconia St
- 24 Hadwen Rd
Your Personal Tour Guide
Ask me questions while you tour the home.