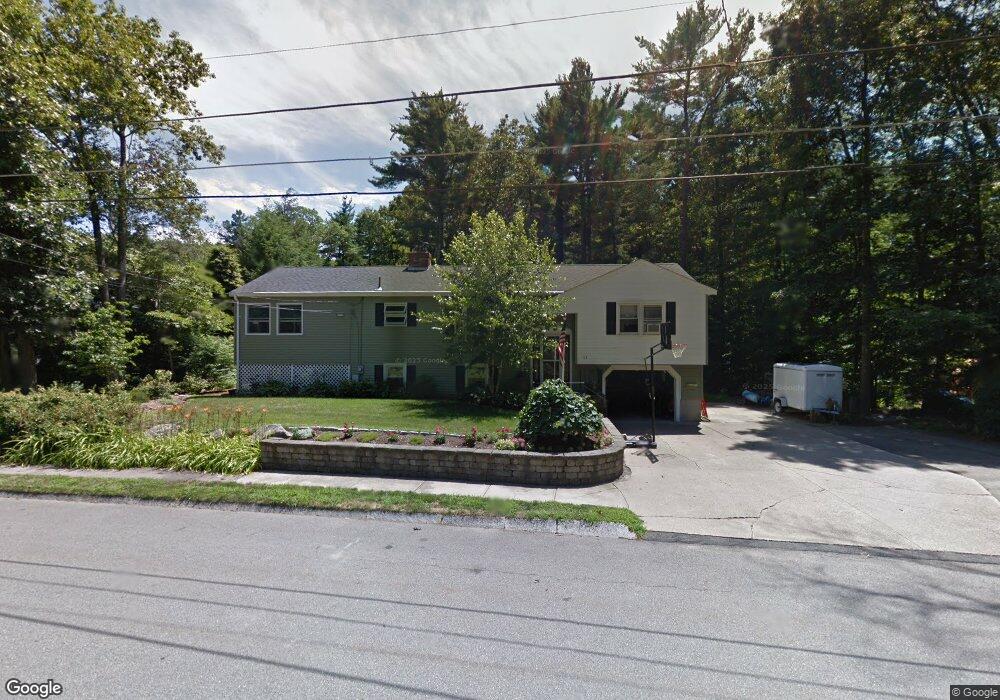
65 Borrows Rd Foxboro, MA 02035
Estimated Value: $624,506 - $746,000
3
Beds
4
Baths
1,520
Sq Ft
$454/Sq Ft
Est. Value
About This Home
This home is located at 65 Borrows Rd, Foxboro, MA 02035 and is currently estimated at $689,627, approximately $453 per square foot. 65 Borrows Rd is a home located in Norfolk County with nearby schools including Foxborough High School, Discovery Daycare Center, and Hands-On-Montessori School.
Ownership History
Date
Name
Owned For
Owner Type
Purchase Details
Closed on
Jul 29, 2009
Sold by
Loftus Maureen A and Loftus Richard T
Bought by
Loftus Maureen A
Current Estimated Value
Home Financials for this Owner
Home Financials are based on the most recent Mortgage that was taken out on this home.
Original Mortgage
$80,000
Interest Rate
5.43%
Mortgage Type
Purchase Money Mortgage
Purchase Details
Closed on
Sep 1, 1993
Sold by
Thompson Ruth
Bought by
Loftus Richard T and Loftus Maureen A
Home Financials for this Owner
Home Financials are based on the most recent Mortgage that was taken out on this home.
Original Mortgage
$100,000
Interest Rate
7.11%
Mortgage Type
Purchase Money Mortgage
Create a Home Valuation Report for This Property
The Home Valuation Report is an in-depth analysis detailing your home's value as well as a comparison with similar homes in the area
Home Values in the Area
Average Home Value in this Area
Purchase History
| Date | Buyer | Sale Price | Title Company |
|---|---|---|---|
| Loftus Maureen A | -- | -- | |
| Loftus Richard T | $147,500 | -- |
Source: Public Records
Mortgage History
| Date | Status | Borrower | Loan Amount |
|---|---|---|---|
| Open | Loftus Richard T | $100,000 | |
| Closed | Loftus Maureen A | $80,000 | |
| Previous Owner | Loftus Richard T | $50,000 | |
| Previous Owner | Loftus Richard T | $25,000 | |
| Previous Owner | Loftus Richard T | $100,000 |
Source: Public Records
Tax History
| Year | Tax Paid | Tax Assessment Tax Assessment Total Assessment is a certain percentage of the fair market value that is determined by local assessors to be the total taxable value of land and additions on the property. | Land | Improvement |
|---|---|---|---|---|
| 2025 | $7,452 | $563,700 | $240,500 | $323,200 |
| 2024 | $7,183 | $531,700 | $244,900 | $286,800 |
| 2023 | $7,006 | $493,000 | $233,200 | $259,800 |
| 2022 | $6,366 | $438,400 | $195,500 | $242,900 |
| 2021 | $5,946 | $403,400 | $181,000 | $222,400 |
| 2020 | $5,534 | $379,800 | $181,000 | $198,800 |
| 2019 | $5,474 | $372,400 | $172,400 | $200,000 |
| 2018 | $5,325 | $365,500 | $172,400 | $193,100 |
| 2017 | $5,198 | $345,600 | $161,100 | $184,500 |
| 2016 | $5,269 | $355,500 | $162,400 | $193,100 |
| 2015 | $5,365 | $353,200 | $137,300 | $215,900 |
| 2014 | $5,160 | $344,200 | $128,300 | $215,900 |
Source: Public Records
Map
Nearby Homes
- 17 Childs Ln
- 128 Tremont St
- 1769 West St
- 346 South St
- 25 Shepherd St
- 24 Maverick Dr
- 40 Treasure Island Rd
- 16 Treasure Island Rd
- 33 Colonial Way
- 9 Coach Rd
- 46 Mirimichi St
- 84 Messenger St
- 356 Central St
- 155 South St
- 166 Chauncy St
- 150 Gilbert St
- 14 Claire Ave
- 233 Central St
- 25 Munroe Dr
- 150 Rumford Ave Unit 110
Your Personal Tour Guide
Ask me questions while you tour the home.