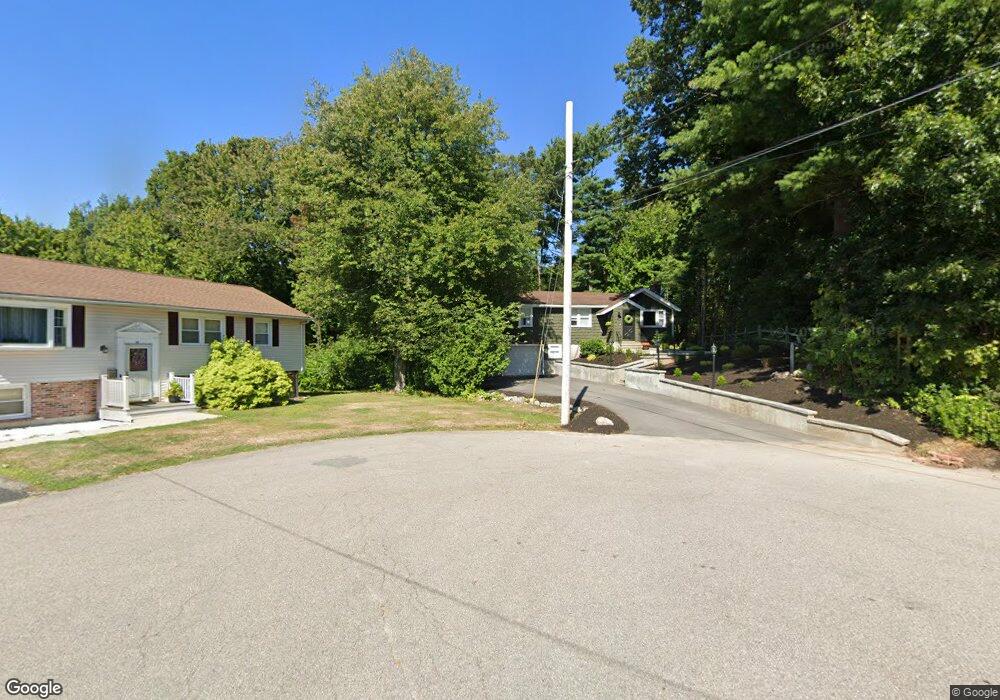
65 Bradford Rd South Weymouth, MA 02190
South Weymouth NeighborhoodEstimated Value: $660,236 - $757,000
4
Beds
3
Baths
1,486
Sq Ft
$471/Sq Ft
Est. Value
About This Home
This home is located at 65 Bradford Rd, South Weymouth, MA 02190 and is currently estimated at $700,059, approximately $471 per square foot. 65 Bradford Rd is a home located in Norfolk County with nearby schools including Ralph Talbot Primary School, Abigail Adams Middle School, and Weymouth Middle School Chapman.
Ownership History
Date
Name
Owned For
Owner Type
Purchase Details
Closed on
Sep 19, 2006
Sold by
Anderson Arthur L
Bought by
Madeira Armando M and Madeira Christina
Current Estimated Value
Home Financials for this Owner
Home Financials are based on the most recent Mortgage that was taken out on this home.
Original Mortgage
$179,500
Outstanding Balance
$108,031
Interest Rate
6.71%
Mortgage Type
Purchase Money Mortgage
Estimated Equity
$592,028
Create a Home Valuation Report for This Property
The Home Valuation Report is an in-depth analysis detailing your home's value as well as a comparison with similar homes in the area
Home Values in the Area
Average Home Value in this Area
Purchase History
| Date | Buyer | Sale Price | Title Company |
|---|---|---|---|
| Madeira Armando M | $364,500 | -- |
Source: Public Records
Mortgage History
| Date | Status | Borrower | Loan Amount |
|---|---|---|---|
| Open | Madeira Armando M | $179,500 |
Source: Public Records
Tax History Compared to Growth
Tax History
| Year | Tax Paid | Tax Assessment Tax Assessment Total Assessment is a certain percentage of the fair market value that is determined by local assessors to be the total taxable value of land and additions on the property. | Land | Improvement |
|---|---|---|---|---|
| 2025 | $5,989 | $593,000 | $237,300 | $355,700 |
| 2024 | $5,796 | $564,400 | $226,000 | $338,400 |
| 2023 | $5,710 | $546,400 | $228,300 | $318,100 |
| 2022 | $5,617 | $490,100 | $211,400 | $278,700 |
| 2021 | $4,934 | $420,300 | $211,400 | $208,900 |
| 2020 | $4,685 | $393,000 | $211,400 | $181,600 |
| 2019 | $4,492 | $370,600 | $203,300 | $167,300 |
| 2018 | $4,359 | $348,700 | $193,600 | $155,100 |
| 2017 | $4,282 | $334,300 | $184,400 | $149,900 |
| 2016 | $4,116 | $321,600 | $177,300 | $144,300 |
| 2015 | $3,984 | $308,800 | $177,300 | $131,500 |
| 2014 | $3,881 | $291,800 | $165,000 | $126,800 |
Source: Public Records
Map
Nearby Homes
- 5 Oak St
- 206 Pine St
- 41 Oak St
- 446 Ralph Talbot St
- 261 Pleasant St Unit 5
- 17 Sears Rd
- 120 Burkhall St Unit K
- 159 Tall Oaks Dr Unit D
- 121 Tall Oaks Dr Unit Q
- 200 Burkhall St Unit 803
- 11 White St
- 26 Leahaven Rd
- 45 Union St
- 32 Weaver Rd
- 54 Old Quarry Dr
- 299 Union St
- 27 Park Ave
- 79 Tilden Rd
- 17 Buchanan Ln
- 18 Ben Hogan Landing Unit 18