G
Seller's Agent in 2016
Grace Edrington
Horizon Sotheby's International Realty

Estimated Value: $189,771 - $208,000
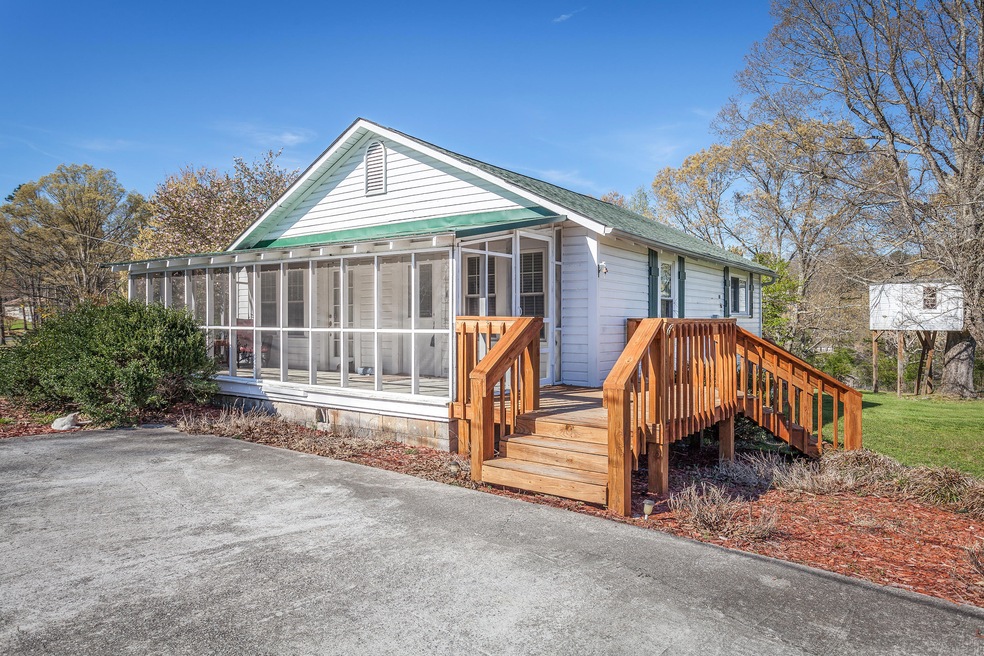
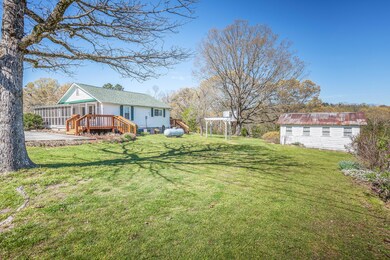
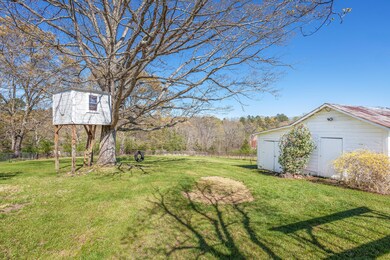
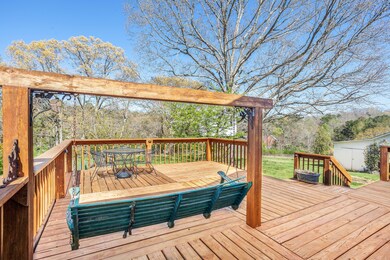
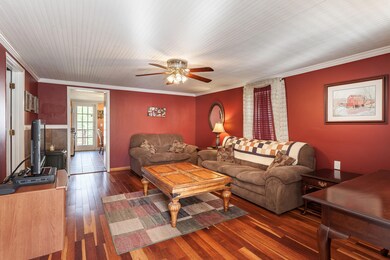
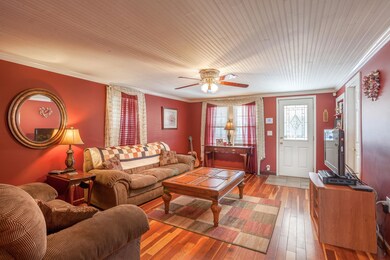
Whether you're a first-time home buyer or are looking to downsize into something more manageable this is a great option. Sitting on half an acre in the country, this house has a huge yard, with a storage shed and a cool tree house in an amazing, mature shade tree the kids will love! It's a peaceful property with wooded land all around and the awesome back deck is the perfect place to enjoy it all. Perfect for your morning coffee or to host a cookout with your friends/family, you'll love the exterior space of this home. Inside has been nicely updated with lovely floors, newly remodeled kitchen, as well as new bathroom. It's hard to imagine getting all this for such a great price. Look at the pictures and then call for your private showing today!
Last Agent to Sell the Property
Grace Edrington
Horizon Sotheby's International Realty Listed on: 04/01/2016
Last Buyer's Agent
Randy Durham
Keller Williams Realty
We collect this data history from publicly available records. To have your information removed, we recommend requesting removal directly through your county’s website.
We collect this data history from publicly available records. To have your information removed, we recommend requesting removal directly through your county’s website.
| Date | Buyer | Sale Price | Title Company |
|---|---|---|---|
| $120,000 | -- | ||
| $95,000 | -- | ||
| $72,000 | -- | ||
| $82,000 | -- |
We collect this data history from publicly available records. To have your information removed, we recommend requesting removal directly through your county’s website.
| Date | Status | Borrower | Loan Amount |
|---|---|---|---|
| Open | $121,212 | ||
| Previous Owner | $97,686 | ||
| Previous Owner | $65,600 |
We collect this data history from publicly available records. To have your information removed, we recommend requesting removal directly through your county’s website.
| Date | Event | Price | List to Sale | Price per Sq Ft |
|---|---|---|---|---|
| 05/20/2016 05/20/16 | Sold | $95,000 | -5.0% | $106 / Sq Ft |
| 04/08/2016 04/08/16 | Pending | -- | -- | -- |
| 04/01/2016 04/01/16 | For Sale | $100,000 | -- | $112 / Sq Ft |
We collect this data history from publicly available records. To have your information removed, we recommend requesting removal directly through your county’s website.
| Year | Tax Paid | Tax Assessment Tax Assessment Total Assessment is a certain percentage of the fair market value that is determined by local assessors to be the total taxable value of land and additions on the property. | Land | Improvement |
|---|---|---|---|---|
| 2025 | $1,067 | $56,216 | $10,000 | $46,216 |
| 2024 | $1,121 | $52,566 | $8,264 | $44,302 |
| 2023 | $927 | $41,396 | $8,264 | $33,132 |
| 2022 | $723 | $32,314 | $8,264 | $24,050 |
| 2021 | $676 | $32,314 | $8,264 | $24,050 |
| 2020 | $668 | $28,848 | $8,264 | $20,584 |
| 2019 | $675 | $28,848 | $8,264 | $20,584 |
| 2018 | $713 | $28,848 | $8,264 | $20,584 |
| 2017 | $702 | $28,416 | $8,264 | $20,152 |
| 2016 | $616 | $25,693 | $8,264 | $17,429 |
| 2015 | -- | $25,693 | $8,264 | $17,429 |
| 2014 | -- | $25,693 | $8,264 | $17,429 |
| 2013 | -- | $20,818 | $8,263 | $12,555 |
G
Seller's Agent in 2016
Grace Edrington
Horizon Sotheby's International Realty
R
Buyer's Agent in 2016
Randy Durham
Keller Williams Realty
Source: Greater Chattanooga REALTORS®
MLS Number: 1243585
APN: 0037D-051
Disclaimer: Certain information contained herein is derived from information provided by parties other than Homes.com. All information provided is deemed reliable, but is not guaranteed to be accurate and should be independently verified.
![]() IDX information is provided exclusively for consumers’ personal, noncommercial use, that it may not be used for any purpose other than to identify prospective properties consumers may be interested in purchasing.
IDX information is provided exclusively for consumers’ personal, noncommercial use, that it may not be used for any purpose other than to identify prospective properties consumers may be interested in purchasing.
Data is deemed reliable but is not guaranteed accurate by the MLS.
Ten-X does not display the entire MLS of Chattanooga, Inc. database on this website. The listings of some real estate brokerage firms have been excluded. Some or all of the listings displayed may not belong to the firm whose website is being visited
Copyright© 2026 by Chattanooga Association of REALTORS®
Ask me questions while you tour the home.