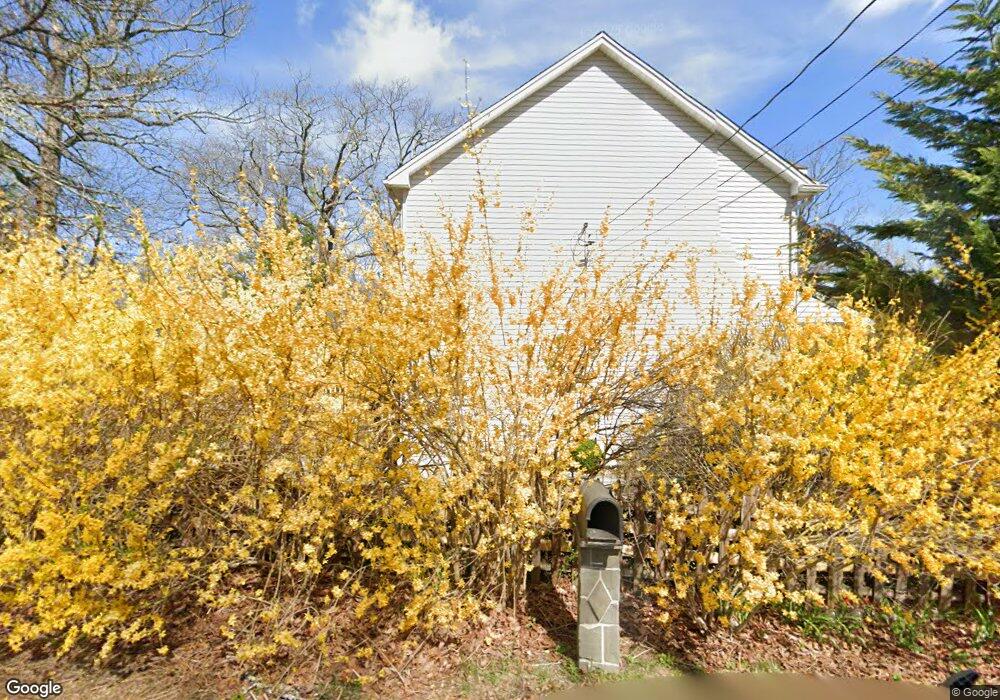
65 Chatham Rd Hewitt, NJ 07421
Estimated Value: $449,000 - $490,000
--
Bed
--
Bath
1,604
Sq Ft
$293/Sq Ft
Est. Value
About This Home
This home is located at 65 Chatham Rd, Hewitt, NJ 07421 and is currently estimated at $469,746, approximately $292 per square foot. 65 Chatham Rd is a home located in Passaic County with nearby schools including Macopin Middle School and West Milford High School.
Ownership History
Date
Name
Owned For
Owner Type
Purchase Details
Closed on
Oct 2, 2003
Sold by
Leonescu Scott
Bought by
Araujo Victor and Ferreira Sonia
Current Estimated Value
Home Financials for this Owner
Home Financials are based on the most recent Mortgage that was taken out on this home.
Original Mortgage
$246,905
Outstanding Balance
$116,326
Interest Rate
6.35%
Estimated Equity
$353,420
Purchase Details
Closed on
Apr 23, 2003
Sold by
Sadd Margaret
Bought by
Leonecu Scott and Blood George
Home Financials for this Owner
Home Financials are based on the most recent Mortgage that was taken out on this home.
Original Mortgage
$62,900
Interest Rate
5.86%
Create a Home Valuation Report for This Property
The Home Valuation Report is an in-depth analysis detailing your home's value as well as a comparison with similar homes in the area
Home Values in the Area
Average Home Value in this Area
Purchase History
| Date | Buyer | Sale Price | Title Company |
|---|---|---|---|
| Araujo Victor | $259,900 | -- | |
| Leonecu Scott | $74,000 | -- |
Source: Public Records
Mortgage History
| Date | Status | Borrower | Loan Amount |
|---|---|---|---|
| Open | Araujo Victor | $246,905 | |
| Previous Owner | Leonecu Scott | $62,900 |
Source: Public Records
Tax History Compared to Growth
Tax History
| Year | Tax Paid | Tax Assessment Tax Assessment Total Assessment is a certain percentage of the fair market value that is determined by local assessors to be the total taxable value of land and additions on the property. | Land | Improvement |
|---|---|---|---|---|
| 2025 | $10,390 | $256,300 | $71,500 | $184,800 |
| 2024 | $10,444 | $256,300 | $71,500 | $184,800 |
| 2022 | $10,224 | $256,300 | $71,500 | $184,800 |
| 2021 | $9,701 | $256,300 | $71,500 | $184,800 |
| 2020 | $9,598 | $256,300 | $71,500 | $184,800 |
| 2019 | $9,470 | $256,300 | $71,500 | $184,800 |
| 2018 | $9,447 | $256,300 | $71,500 | $184,800 |
| 2017 | $9,491 | $256,300 | $71,500 | $184,800 |
| 2016 | $9,506 | $256,300 | $71,500 | $184,800 |
| 2015 | $9,396 | $256,300 | $71,500 | $184,800 |
| 2014 | $9,168 | $256,300 | $71,500 | $184,800 |
Source: Public Records
Map
Nearby Homes
- 40 Kingsland Rd
- 96 Papscoe Rd
- 00 Linwood Rd
- 16 Hampton Rd
- 74 Riverside Rd
- 0 Gladstone Rd
- 43 Hampton Rd
- 36 Morsemere Rd
- 147 Papscoe Rd
- 7 Chatham Rd
- 360 Lake Shore Dr
- 3 Riverside Rd
- 5 Fanwood Ct
- 424 Lake Shore Dr
- 40 Upper Greenwood Lake Rd
- 40 Upper Greenwood Rd
- 0 Kresson Rd
- 00 Fairlawn Dr
- 109 Fairlawn Dr
- 54 Race Track Dr