Estimated Value: $708,630 - $1,406,000
3
Beds
2
Baths
1,328
Sq Ft
$754/Sq Ft
Est. Value
About This Home
This home is located at 65 Colard Ln, Lyons, CO 80540 and is currently estimated at $1,000,908, approximately $753 per square foot. 65 Colard Ln is a home located in Larimer County with nearby schools including Lyons Elementary School and Lyons Middle/Senior High School.
Ownership History
Date
Name
Owned For
Owner Type
Purchase Details
Closed on
Jan 21, 2005
Sold by
Fenn Wyatt
Bought by
Hansburg Stephen B and Hansburg Virginia Davidson
Current Estimated Value
Home Financials for this Owner
Home Financials are based on the most recent Mortgage that was taken out on this home.
Original Mortgage
$452,000
Outstanding Balance
$243,791
Interest Rate
7.12%
Mortgage Type
Purchase Money Mortgage
Estimated Equity
$757,117
Purchase Details
Closed on
Feb 3, 1998
Sold by
Fenn Julie D and Fenn Wyatt
Bought by
Fenn Wyatt
Home Financials for this Owner
Home Financials are based on the most recent Mortgage that was taken out on this home.
Original Mortgage
$220,000
Interest Rate
7.23%
Purchase Details
Closed on
Aug 5, 1997
Sold by
Fenn Julie D
Bought by
Fenn Wyatt and Fenn Julie D
Home Financials for this Owner
Home Financials are based on the most recent Mortgage that was taken out on this home.
Original Mortgage
$139,900
Interest Rate
7.47%
Create a Home Valuation Report for This Property
The Home Valuation Report is an in-depth analysis detailing your home's value as well as a comparison with similar homes in the area
Purchase History
| Date | Buyer | Sale Price | Title Company |
|---|---|---|---|
| Hansburg Stephen B | $565,000 | Fahtco | |
| Fenn Wyatt | -- | -- | |
| Fenn Wyatt | -- | -- |
Source: Public Records
Mortgage History
| Date | Status | Borrower | Loan Amount |
|---|---|---|---|
| Open | Hansburg Stephen B | $452,000 | |
| Previous Owner | Fenn Wyatt | $220,000 | |
| Previous Owner | Fenn Wyatt | $139,900 | |
| Closed | Hansburg Stephen B | $82,500 |
Source: Public Records
Tax History
| Year | Tax Paid | Tax Assessment Tax Assessment Total Assessment is a certain percentage of the fair market value that is determined by local assessors to be the total taxable value of land and additions on the property. | Land | Improvement |
|---|---|---|---|---|
| 2025 | $5,036 | $52,663 | $18,000 | $34,663 |
| 2024 | $4,990 | $59,308 | $19,296 | $40,012 |
| 2022 | $3,161 | $37,794 | $14,692 | $23,102 |
| 2021 | $3,146 | $38,882 | $15,115 | $23,767 |
| 2020 | $1,936 | $26,749 | $12,513 | $14,236 |
| 2019 | $1,945 | $26,749 | $12,513 | $14,236 |
| 2018 | $2,383 | $31,277 | $10,800 | $20,477 |
| 2017 | $2,368 | $31,277 | $10,800 | $20,477 |
| 2016 | $2,333 | $31,442 | $11,940 | $19,502 |
| 2015 | $2,969 | $31,440 | $11,940 | $19,500 |
| 2014 | $2,417 | $25,530 | $13,530 | $12,000 |
Source: Public Records
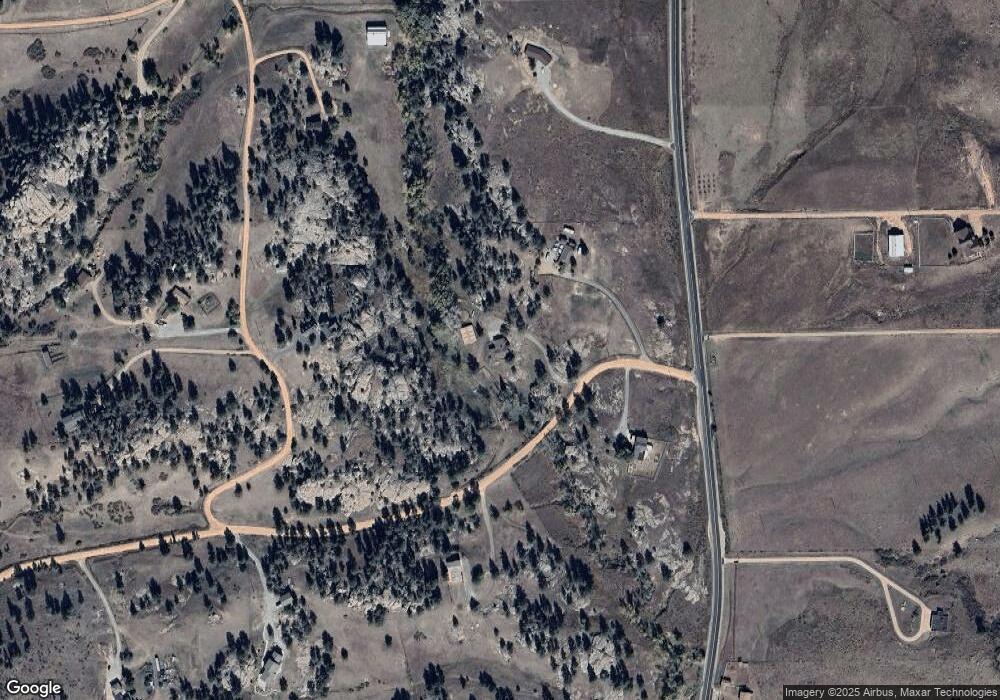
Map
Nearby Homes
- 1312 Steamboat Valley Rd
- 1960 Colard Ln
- 1570 County Road 37e
- 108 Lonestar Rd
- 702 Ponderosa Hill Rd
- 101 Lewis Ln
- 1190 Lonestar Rd
- 1669 Apple Valley Rd
- 0 Longmont Dam Rd Unit 1
- 0 Longmont Dam Rd Unit 2
- 0 Longmont Dam Rd Unit 3
- 3665 Colard Ln
- 1165 Stagecoach Trail
- 1285 Eagle Ridge Rd
- 119 Eagle Canyon Cir
- 2685 Eagle Ridge Rd
- 15655 Mossrock Dr
- 2615 Eagle Ridge Rd
- 1117 N 5th Ave
- 1117 5th Ave
- 31 Colard Ln
- 38 Colard Ln
- 140 Lake Dr
- 150 Colard Ln
- 397 Blue Mountain Trail
- 145 Lake Dr
- 296 Lake Dr
- 0 Blue Mountain Rd
- 300 Colard Ln
- 501 Blue Mountain Rd
- 501 Blue Mountain Rd
- 427 Lake Dr
- 18 Blue Mountain Rd
- 423 County Road 37 E
- 226 Blue Mountain Trail
- 294 County Road 37e
- 12 Elk Run Ranch
- 398 Colard Ln
- 565 Blue Mountain Rd
- 3 Blue Mountain Rd
Your Personal Tour Guide
Ask me questions while you tour the home.