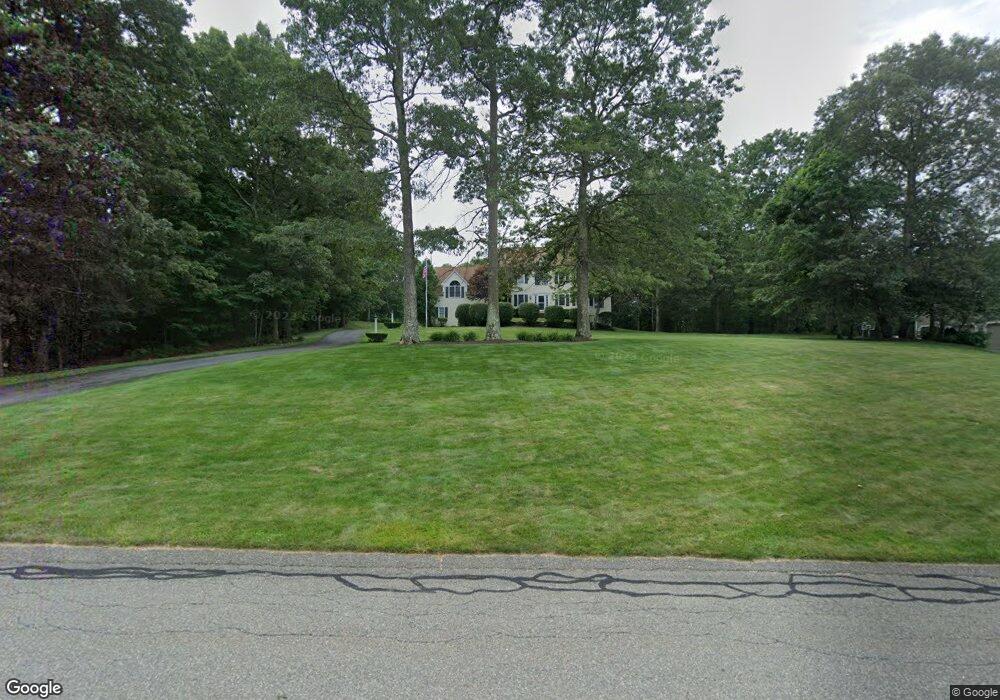
65 Comstock Dr Wrentham, MA 02093
West Wrentham NeighborhoodEstimated Value: $1,088,000 - $1,184,000
4
Beds
3
Baths
3,230
Sq Ft
$351/Sq Ft
Est. Value
About This Home
This home is located at 65 Comstock Dr, Wrentham, MA 02093 and is currently estimated at $1,134,173, approximately $351 per square foot. 65 Comstock Dr is a home located in Norfolk County with nearby schools including Delaney Elementary School, Charles E Roderick, and Mercymount Country Day School.
Ownership History
Date
Name
Owned For
Owner Type
Purchase Details
Closed on
Apr 2, 1997
Sold by
Perkins Walter R
Bought by
Sanislow Todd R
Current Estimated Value
Purchase Details
Closed on
May 30, 1995
Sold by
Bailey & Zahner Bldrs
Bought by
Perkins Walter R
Create a Home Valuation Report for This Property
The Home Valuation Report is an in-depth analysis detailing your home's value as well as a comparison with similar homes in the area
Home Values in the Area
Average Home Value in this Area
Purchase History
| Date | Buyer | Sale Price | Title Company |
|---|---|---|---|
| Sanislow Todd R | $355,000 | -- | |
| Perkins Walter R | $335,000 | -- |
Source: Public Records
Mortgage History
| Date | Status | Borrower | Loan Amount |
|---|---|---|---|
| Open | Perkins Walter R | $223,050 | |
| Closed | Perkins Walter R | $229,000 | |
| Closed | Perkins Walter R | $260,000 |
Source: Public Records
Tax History Compared to Growth
Tax History
| Year | Tax Paid | Tax Assessment Tax Assessment Total Assessment is a certain percentage of the fair market value that is determined by local assessors to be the total taxable value of land and additions on the property. | Land | Improvement |
|---|---|---|---|---|
| 2025 | $11,209 | $967,100 | $299,600 | $667,500 |
| 2024 | $10,777 | $898,100 | $299,600 | $598,500 |
| 2023 | $10,702 | $848,000 | $272,400 | $575,600 |
| 2022 | $10,278 | $751,900 | $245,600 | $506,300 |
| 2021 | $9,663 | $686,800 | $219,400 | $467,400 |
| 2020 | $10,290 | $722,100 | $200,400 | $521,700 |
| 2019 | $9,616 | $681,000 | $182,100 | $498,900 |
| 2018 | $8,622 | $605,500 | $181,900 | $423,600 |
| 2017 | $8,452 | $593,100 | $178,400 | $414,700 |
| 2016 | $8,281 | $579,900 | $173,300 | $406,600 |
| 2015 | $8,197 | $547,200 | $166,600 | $380,600 |
| 2014 | $8,237 | $538,000 | $160,200 | $377,800 |
Source: Public Records
Map
Nearby Homes
- 60 Grant Ave
- 50 Heather Ln
- 236 Williams St
- 39 Sumner Brown Rd
- 2095 West St
- 180 Pine Swamp Rd
- 56 Pine Swamp Rd
- 25 Nature View Dr
- 20 Nature View Dr
- 300 Tower Hill Rd
- 4022 Diamond Hill Rd
- 17 Stanford Rd
- 851 Washington St
- 9 Pebble Cir Unit 9
- 4 Evans St
- 10 Stanford Rd
- 219 Dawn Blvd
- 245 W Wrentham Rd
- 65 Palmetto Dr Unit 65
- 21 Palmetto Dr Unit 21