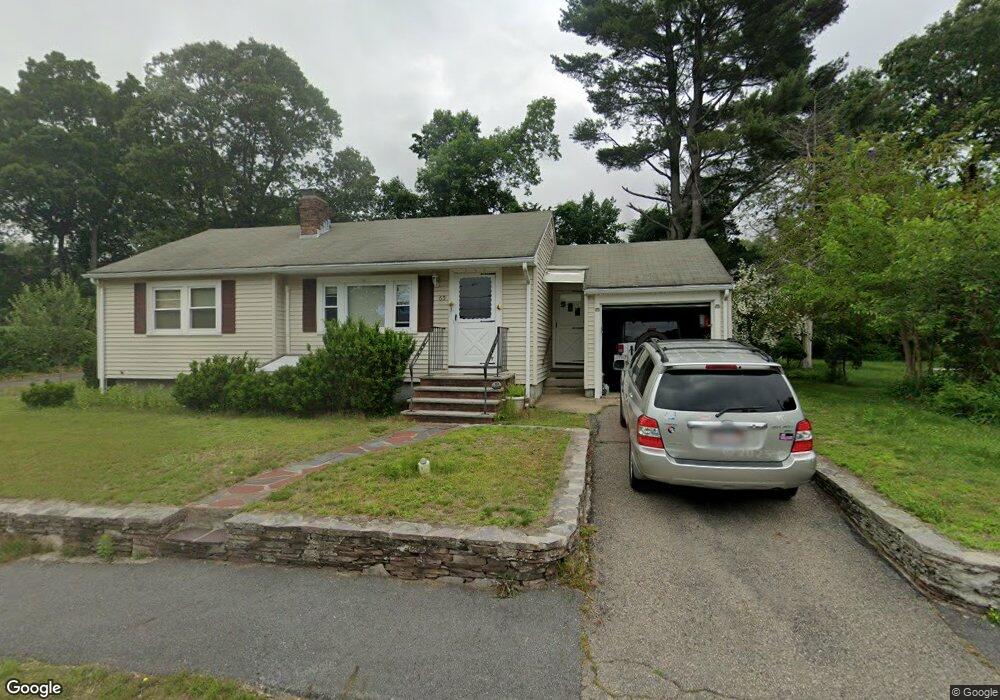
65 Cranmore Rd Norwood, MA 02062
South Norwood NeighborhoodEstimated Value: $510,000 - $630,000
2
Beds
1
Bath
785
Sq Ft
$728/Sq Ft
Est. Value
About This Home
This home is located at 65 Cranmore Rd, Norwood, MA 02062 and is currently estimated at $571,361, approximately $727 per square foot. 65 Cranmore Rd is a home located in Norfolk County with nearby schools including Norwood High School, St Catherine Of Siena School, and Norwood Montessori School.
Ownership History
Date
Name
Owned For
Owner Type
Purchase Details
Closed on
Jan 2, 2019
Sold by
Dziuba Craig
Bought by
Solomon Marvin
Current Estimated Value
Purchase Details
Closed on
Apr 16, 1998
Sold by
Wolf Louise E
Bought by
Ippolito Diane
Home Financials for this Owner
Home Financials are based on the most recent Mortgage that was taken out on this home.
Original Mortgage
$146,687
Interest Rate
7.05%
Create a Home Valuation Report for This Property
The Home Valuation Report is an in-depth analysis detailing your home's value as well as a comparison with similar homes in the area
Home Values in the Area
Average Home Value in this Area
Purchase History
| Date | Buyer | Sale Price | Title Company |
|---|---|---|---|
| Solomon Marvin | $286,000 | -- | |
| Ippolito Diane | $155,400 | -- |
Source: Public Records
Mortgage History
| Date | Status | Borrower | Loan Amount |
|---|---|---|---|
| Previous Owner | Ippolito Diane | $207,000 | |
| Previous Owner | Ippolito Diane | $146,687 | |
| Previous Owner | Ippolito Diane | $146,687 |
Source: Public Records
Tax History Compared to Growth
Tax History
| Year | Tax Paid | Tax Assessment Tax Assessment Total Assessment is a certain percentage of the fair market value that is determined by local assessors to be the total taxable value of land and additions on the property. | Land | Improvement |
|---|---|---|---|---|
| 2025 | $48 | $459,200 | $269,400 | $189,800 |
| 2024 | $4,847 | $462,900 | $269,400 | $193,500 |
| 2023 | $4,369 | $423,400 | $234,300 | $189,100 |
| 2022 | $4,112 | $382,500 | $213,000 | $169,500 |
| 2021 | $3,933 | $346,800 | $205,200 | $141,600 |
| 2020 | $3,753 | $336,600 | $205,200 | $131,400 |
| 2019 | $3,646 | $334,800 | $195,400 | $139,400 |
| 2018 | $3,472 | $313,100 | $186,100 | $127,000 |
| 2017 | $3,384 | $303,500 | $186,100 | $117,400 |
| 2016 | $3,215 | $289,100 | $186,100 | $103,000 |
| 2015 | $3,218 | $280,600 | $177,600 | $103,000 |
| 2014 | $2,992 | $258,400 | $161,100 | $97,300 |
Source: Public Records
Map
Nearby Homes
- 132-134 Edgehill Rd
- 114 Neponset St
- 0 Deerfield Rd
- 794 Neponset St
- 6 Talbot Farm Rd
- 136 Azalea Dr
- 146 Juniper Dr
- 816 Neponset St
- 0 Quail Run
- 105 E Cross St
- 22 Hillside Ave
- 42 Queensboro Ct Unit 42
- 15-17 Heaton Ave
- 1086 Washington St
- 53 Hampden Dr
- 56 Mill Pond Ln
- 909 Washington St Unit 14
- 31-33 Chapel St
- 19-21
- 868 Washington St
- 59 Cranmore Rd
- 60 Whitewood Cir Unit 1
- 60 Whitewood Cir Unit 60
- 60 Whitewood Cir
- 58 Whitewood Cir Unit 60
- 236 Richland Rd
- 66 Cranmore Rd
- 223 Richland Rd
- 53 Whitewood Cir Unit 55
- 55 Whitewood Cir
- 55 Whitewood Cir Unit 1
- 230 Richland Rd
- 3 Belnap Rd
- 51 Cranmore Rd
- 52 Whitewood Cir Unit 54
- 52 Whitewood Cir Unit 52
- 215 Richland Rd
- 224 Richland Rd
- 54 Whitewood Cir Unit 54
- 9 Belnap Rd