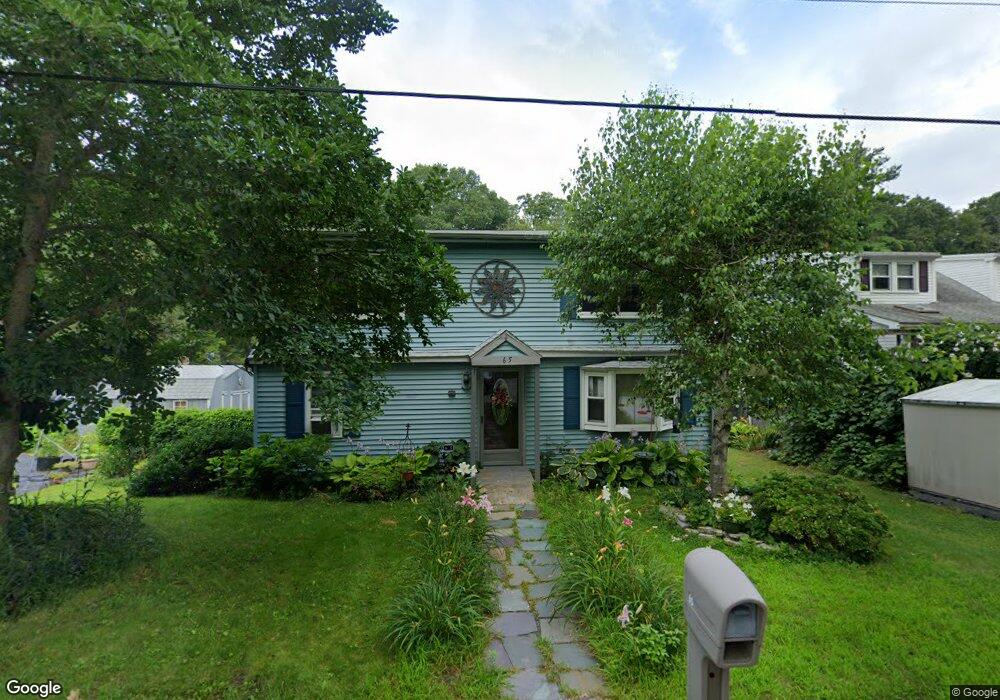
65 Depot St Douglas, MA 01516
Estimated Value: $394,777 - $455,000
3
Beds
2
Baths
1,656
Sq Ft
$252/Sq Ft
Est. Value
About This Home
This home is located at 65 Depot St, Douglas, MA 01516 and is currently estimated at $417,694, approximately $252 per square foot. 65 Depot St is a home located in Worcester County with nearby schools including Douglas Primary School, Douglas Middle School, and Douglas High School.
Ownership History
Date
Name
Owned For
Owner Type
Purchase Details
Closed on
Jun 22, 2016
Sold by
Frechette Steven W and Frechette Beatrice B
Bought by
Frechette Beatrice B
Current Estimated Value
Purchase Details
Closed on
Jul 1, 1999
Sold by
Demrest Earl P
Bought by
Frechette Steven W and Frechette Beatrice B
Home Financials for this Owner
Home Financials are based on the most recent Mortgage that was taken out on this home.
Original Mortgage
$116,900
Interest Rate
7.19%
Mortgage Type
Purchase Money Mortgage
Purchase Details
Closed on
Dec 1, 1993
Sold by
Hutnak Construction
Bought by
Halacy Paul T and Halacy Laura
Home Financials for this Owner
Home Financials are based on the most recent Mortgage that was taken out on this home.
Original Mortgage
$90,750
Interest Rate
6.69%
Mortgage Type
Purchase Money Mortgage
Create a Home Valuation Report for This Property
The Home Valuation Report is an in-depth analysis detailing your home's value as well as a comparison with similar homes in the area
Home Values in the Area
Average Home Value in this Area
Purchase History
| Date | Buyer | Sale Price | Title Company |
|---|---|---|---|
| Frechette Beatrice B | -- | -- | |
| Frechette Steven W | $116,900 | -- | |
| Halacy Paul T | $109,200 | -- |
Source: Public Records
Mortgage History
| Date | Status | Borrower | Loan Amount |
|---|---|---|---|
| Previous Owner | Halacy Paul T | $116,000 | |
| Previous Owner | Halacy Paul T | $116,900 | |
| Previous Owner | Halacy Paul T | $90,750 |
Source: Public Records
Tax History
| Year | Tax Paid | Tax Assessment Tax Assessment Total Assessment is a certain percentage of the fair market value that is determined by local assessors to be the total taxable value of land and additions on the property. | Land | Improvement |
|---|---|---|---|---|
| 2025 | $36 | $274,000 | $86,100 | $187,900 |
| 2024 | $3,553 | $262,800 | $78,200 | $184,600 |
| 2023 | $3,441 | $239,600 | $78,200 | $161,400 |
| 2022 | $3,583 | $219,300 | $72,300 | $147,000 |
| 2021 | $3,454 | $206,600 | $68,800 | $137,800 |
| 2020 | $3,377 | $198,900 | $68,800 | $130,100 |
| 2019 | $3,320 | $189,700 | $68,800 | $120,900 |
| 2018 | $2,975 | $185,100 | $68,800 | $116,300 |
| 2017 | $2,732 | $163,400 | $69,800 | $93,600 |
| 2016 | $2,673 | $158,900 | $69,800 | $89,100 |
| 2015 | $2,615 | $158,900 | $69,800 | $89,100 |
Source: Public Records
Map
Nearby Homes
Your Personal Tour Guide
Ask me questions while you tour the home.