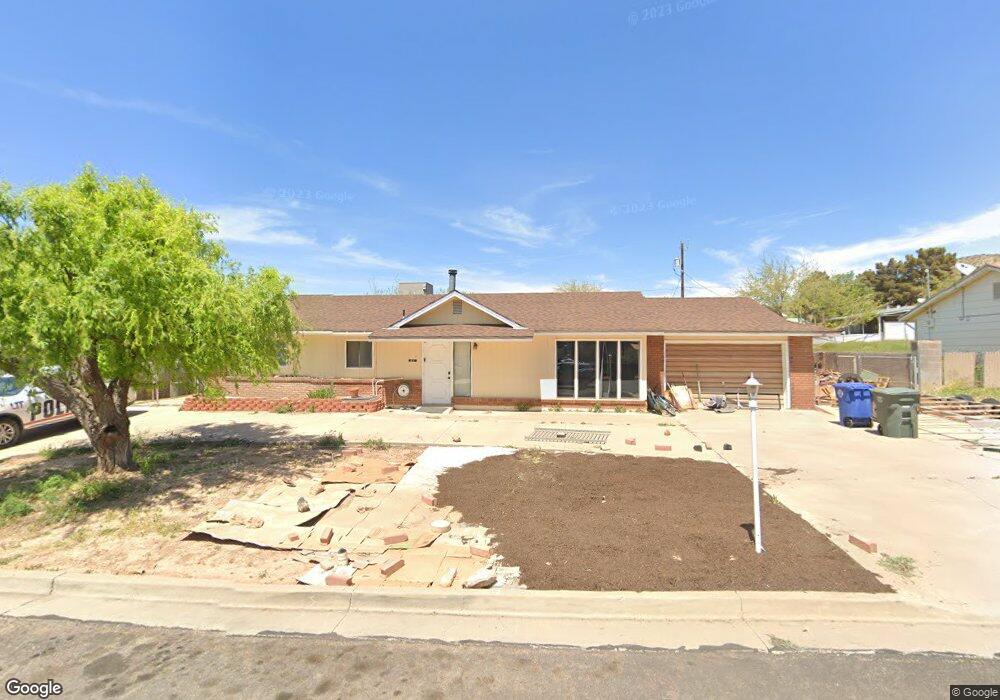
65 E 320 N La Verkin, UT 84745
Estimated Value: $371,000 - $423,000
2
Beds
2
Baths
1,392
Sq Ft
$279/Sq Ft
Est. Value
About This Home
This home is located at 65 E 320 N, La Verkin, UT 84745 and is currently estimated at $388,580, approximately $279 per square foot. 65 E 320 N is a home located in Washington County with nearby schools including La Verkin Elementary School, Hurricane Middle School, and Hurricane High School.
Ownership History
Date
Name
Owned For
Owner Type
Purchase Details
Closed on
Aug 26, 2021
Sold by
Christensen Victor L
Bought by
Palmer Kurt and Palmer Kim
Current Estimated Value
Purchase Details
Closed on
Aug 28, 2017
Sold by
Rosenkillde Andrew W and Rosenkillde Family Trust
Bought by
Osborne Kent S and Osborne Teresa R
Home Financials for this Owner
Home Financials are based on the most recent Mortgage that was taken out on this home.
Original Mortgage
$201,286
Interest Rate
3.87%
Mortgage Type
FHA
Create a Home Valuation Report for This Property
The Home Valuation Report is an in-depth analysis detailing your home's value as well as a comparison with similar homes in the area
Home Values in the Area
Average Home Value in this Area
Purchase History
| Date | Buyer | Sale Price | Title Company |
|---|---|---|---|
| Palmer Kurt | -- | Southern Utah Title Co | |
| Osborne Kent S | -- | First American Title |
Source: Public Records
Mortgage History
| Date | Status | Borrower | Loan Amount |
|---|---|---|---|
| Previous Owner | Osborne Kent S | $201,286 |
Source: Public Records
Tax History
| Year | Tax Paid | Tax Assessment Tax Assessment Total Assessment is a certain percentage of the fair market value that is determined by local assessors to be the total taxable value of land and additions on the property. | Land | Improvement |
|---|---|---|---|---|
| 2025 | $1,512 | $208,450 | $59,400 | $149,050 |
| 2023 | $1,479 | $196,020 | $49,500 | $146,520 |
| 2022 | $1,439 | $179,575 | $33,000 | $146,575 |
| 2021 | $1,382 | $253,900 | $45,000 | $208,900 |
| 2020 | $1,190 | $204,400 | $40,000 | $164,400 |
| 2019 | $1,159 | $190,900 | $40,000 | $150,900 |
| 2018 | $1,087 | $88,165 | $0 | $0 |
| 2017 | $903 | $73,260 | $0 | $0 |
| 2016 | $911 | $70,895 | $0 | $0 |
| 2015 | $927 | $69,355 | $0 | $0 |
| 2014 | $813 | $60,005 | $0 | $0 |
Source: Public Records
Map
Nearby Homes
Your Personal Tour Guide
Ask me questions while you tour the home.