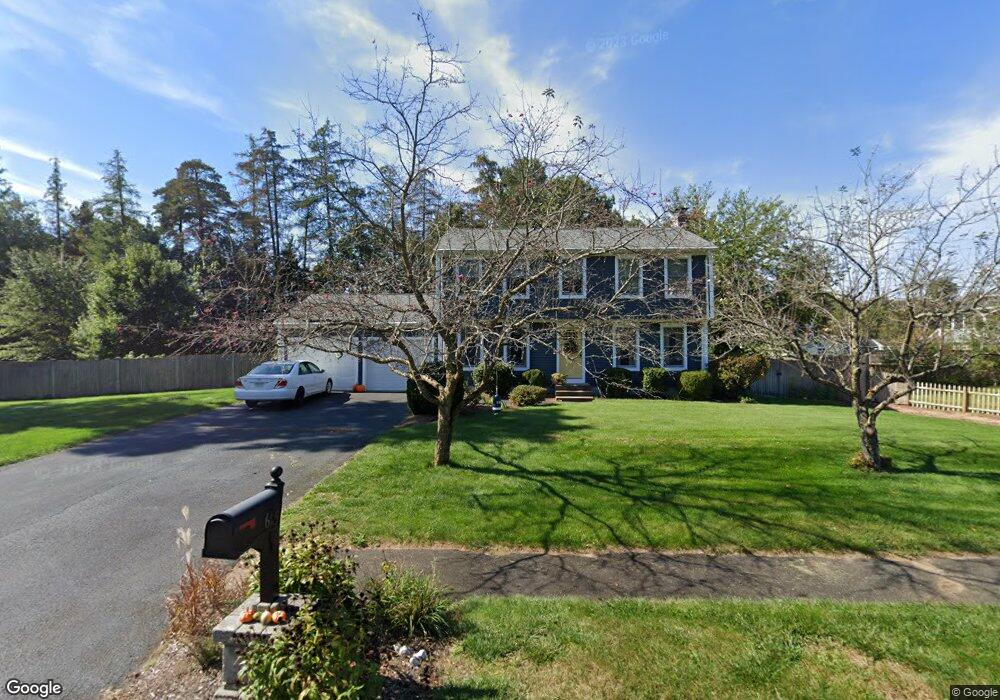
65 E Glen Dr Westfield, MA 01085
Estimated Value: $461,351 - $506,000
4
Beds
3
Baths
1,700
Sq Ft
$284/Sq Ft
Est. Value
About This Home
This home is located at 65 E Glen Dr, Westfield, MA 01085 and is currently estimated at $482,088, approximately $283 per square foot. 65 E Glen Dr is a home located in Hampden County with nearby schools including Westfield High School, White Oak School, and Westfield Christian Academy.
Ownership History
Date
Name
Owned For
Owner Type
Purchase Details
Closed on
Apr 30, 1998
Sold by
Hoang Sam and Wu Fong M
Bought by
Jury John E and Jury Elizabeth S
Current Estimated Value
Home Financials for this Owner
Home Financials are based on the most recent Mortgage that was taken out on this home.
Original Mortgage
$136,000
Outstanding Balance
$26,435
Interest Rate
7.04%
Mortgage Type
Purchase Money Mortgage
Estimated Equity
$455,653
Create a Home Valuation Report for This Property
The Home Valuation Report is an in-depth analysis detailing your home's value as well as a comparison with similar homes in the area
Home Values in the Area
Average Home Value in this Area
Purchase History
| Date | Buyer | Sale Price | Title Company |
|---|---|---|---|
| Jury John E | $146,000 | -- |
Source: Public Records
Mortgage History
| Date | Status | Borrower | Loan Amount |
|---|---|---|---|
| Open | Jury John E | $136,000 |
Source: Public Records
Tax History
| Year | Tax Paid | Tax Assessment Tax Assessment Total Assessment is a certain percentage of the fair market value that is determined by local assessors to be the total taxable value of land and additions on the property. | Land | Improvement |
|---|---|---|---|---|
| 2025 | $5,718 | $376,700 | $118,200 | $258,500 |
| 2024 | $5,732 | $358,900 | $107,300 | $251,600 |
| 2023 | $5,632 | $331,700 | $102,300 | $229,400 |
| 2022 | $5,449 | $294,700 | $91,500 | $203,200 |
| 2021 | $5,281 | $279,700 | $86,000 | $193,700 |
| 2020 | $5,194 | $269,800 | $86,000 | $183,800 |
| 2019 | $5,083 | $258,400 | $81,900 | $176,500 |
| 2018 | $5,003 | $258,400 | $81,900 | $176,500 |
| 2017 | $4,902 | $252,400 | $83,200 | $169,200 |
| 2016 | $4,907 | $252,400 | $83,200 | $169,200 |
| 2015 | $4,568 | $246,400 | $83,200 | $163,200 |
| 2014 | $3,418 | $246,400 | $83,200 | $163,200 |
Source: Public Records
Map
Nearby Homes
- 357 Southampton Rd
- 67 Woodside Terrace
- 19 Arch Rd
- 0 Lockhouse Rd Unit 73473161
- 178 Falcon Dr
- 0 Char Dr
- 7 1st Ave
- 16 1st Ave
- 13 Furrow St
- 24 Francis St
- 24 Sunflower Ln Unit B
- 288 Buck Pond Rd
- 119 Union St Unit 4
- 9 Montgomery St
- Lot 3 Montgomery
- 45 Jaeger Dr
- 12 Sibley Ave
- 103 Woodcliff Dr
- 3 Belmont St
- 83 Mechanic St
Your Personal Tour Guide
Ask me questions while you tour the home.