NOT LISTED FOR SALE

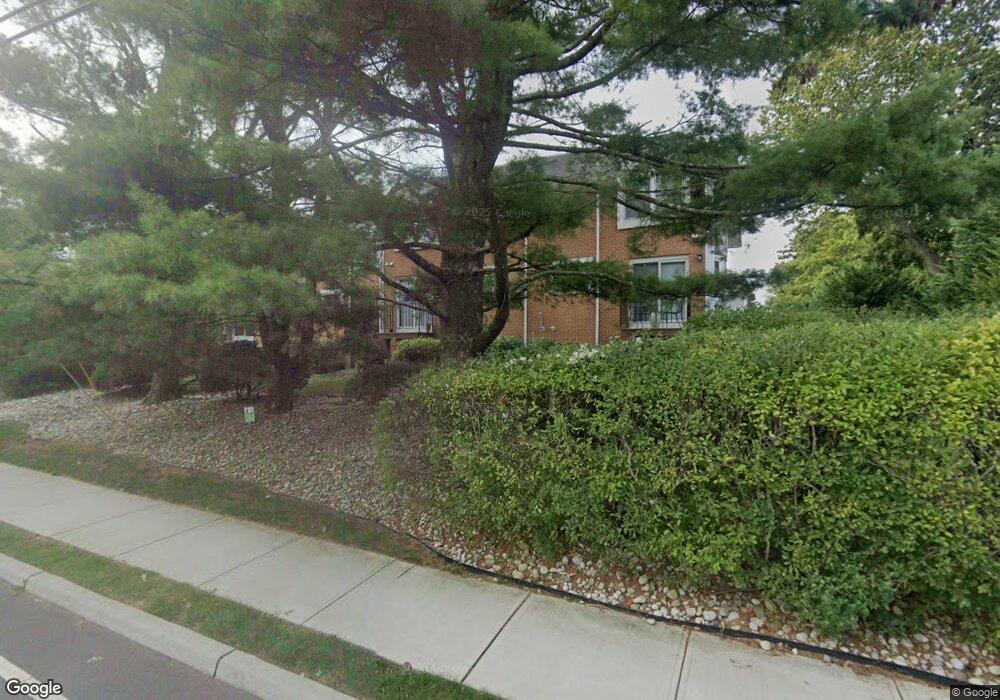
65 E River Rd Unit 40 Rumson, NJ 07760

Estimated Value: $908,000 - $960,132

2 Beds
3 Baths
1,584 Sq Ft
$590/Sq Ft Est. Value

About This Home

This home is located at 65 E River Rd Unit 40, Rumson, NJ 07760 and is currently estimated at $935,283, approximately $590 per square foot. 65 E River Rd Unit 40 is a home located in Monmouth County with nearby schools including Deane Porter School, Forrestdale School, and Rumson Fair Haven Regional High School.

Ownership History

Date Name Owned For Owner Type

Purchase Details

Closed on
Oct 28, 2019
Sold by
Ginson Gerand C and Gibson Alexandra K
Bought by
Sullivan Martin and Sullivan Karen
Current Estimated Value
$935,283

Home Financials for this Owner

Home Financials are based on the most recent Mortgage that was taken out on this home.
Original Mortgage
$145,000
Outstanding Balance
$129,052
Interest Rate
3.65%
Mortgage Type
New Conventional
Estimated Equity
$801,022

Purchase Details

Closed on
Aug 12, 2014
Sold by
Gibson Gerard C and Gibson Alexandra K
Bought by
Alexandra K Gibson Revocable Trust and Gibson Alexandra K

Purchase Details

Closed on
Jul 24, 2000
Sold by
Breach Richard
Bought by
Gibson Gerard and Gibson Alexandra

Home Financials for this Owner

Home Financials are based on the most recent Mortgage that was taken out on this home.
Original Mortgage
$295,000
Interest Rate
8.1%
Source: Public Records

Range of Values:

Collateral Analytics

Collateral Analytics Collateral Analytics AVMs (Automated Valuation Model) employ a number of statistical approaches combined with neighborhood-specific comparable selection guarantees the most up-to-date and precise valuations.

Not Available

Collateral Analytics does not have data for the current month. Please view the chart for historical values.

ICE

ICE Mortgage Technology ICE Mortgage Technology’s AVM (Automated Valuation Model) is a state-of-the-art online residential property valuation tool that provides a quick and accurate estimate of the value of almost any home in the U.S.

Not Available

ICE Mortgage Technology does not have data for the current month. Please view the chart for historical values.

First American

First American First American Data & Analytics’ next-generation AVM combines unrivaled data assets with a blended ensemble of valuation models to produce highly accurate, reliable valuations you can trust.

Not Available

First American does not have data for the current month. Please view the chart for historical values.

Quantarium

Quantarium Quantarium’s valuation service, repeatedly proven the industry’s most accurate and comprehensive, is supercharged with a self-learning and auto-tuning AI engine that continually becomes smarter and more accurate as it processes daily inputs from the industry’s leading RE data lake.

Not Available

Quantarium does not have data for the current month. Please view the chart for historical values.

Average Value
Not Available
List Price
Sold Price
Create a Home Valuation Report for This Property
The Home Valuation Report is an in-depth analysis detailing your home's value as well as a comparison with similar homes in the area

Home Values in the Area

Source: Public Records

Average Home Value in this Area


Source: Public Records

Purchase History

Date Buyer Sale Price Title Company
Sullivan Martin $515,000 Truex Abstract Inc
Alexandra K Gibson Revocable Trust -- None Available
Gibson Gerard $295,000 --
Source: Public Records

Mortgage History

Date Status Borrower Loan Amount
Open Sullivan Martin $145,000
Previous Owner Gibson Gerard $295,000
Source: Public Records

Tax History Compared to Growth

Source: Public Records

Tax History

Year Tax Paid Tax Assessment Tax Assessment Total Assessment is a certain percentage of the fair market value that is determined by local assessors to be the total taxable value of land and additions on the property. Land Improvement
2024 $7,982 $723,500 $555,000 $168,500
2023 $7,982 $682,800 $530,000 $152,800
2022 $7,012 $602,100 $440,000 $162,100
2021 $7,012 $521,400 $375,000 $146,400
2020 $6,610 $461,300 $300,000 $161,300
2019 $6,083 $414,100 $200,000 $214,100
2018 $5,989 $404,100 $200,000 $204,100
2017 $5,845 $397,900 $200,000 $197,900
2016 $5,630 $392,900 $200,000 $192,900
2015 $5,582 $384,200 $200,000 $184,200
2014 $5,525 $379,200 $200,000 $179,200
Source: Public Records

Map