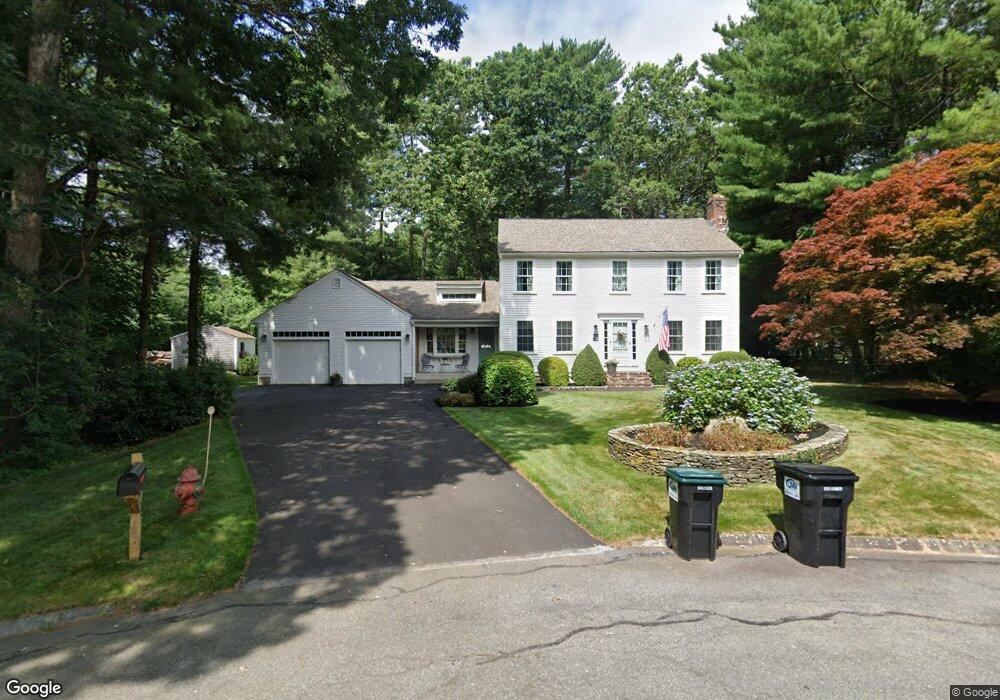
65 Edrich Rd Bridgewater, MA 02324
Estimated Value: $707,000 - $741,271
3
Beds
3
Baths
2,272
Sq Ft
$317/Sq Ft
Est. Value
About This Home
This home is located at 65 Edrich Rd, Bridgewater, MA 02324 and is currently estimated at $719,568, approximately $316 per square foot. 65 Edrich Rd is a home located in Plymouth County with nearby schools including Mitchell Elementary School, Williams Intermediate School, and Bridgewater Middle School.
Ownership History
Date
Name
Owned For
Owner Type
Purchase Details
Closed on
May 2, 1994
Sold by
106 Hale St Rt
Bought by
Bilodeau Wayne P and Tessier Kristie L
Current Estimated Value
Home Financials for this Owner
Home Financials are based on the most recent Mortgage that was taken out on this home.
Original Mortgage
$152,000
Interest Rate
7.7%
Mortgage Type
Purchase Money Mortgage
Create a Home Valuation Report for This Property
The Home Valuation Report is an in-depth analysis detailing your home's value as well as a comparison with similar homes in the area
Home Values in the Area
Average Home Value in this Area
Purchase History
| Date | Buyer | Sale Price | Title Company |
|---|---|---|---|
| Bilodeau Wayne P | $168,900 | -- |
Source: Public Records
Mortgage History
| Date | Status | Borrower | Loan Amount |
|---|---|---|---|
| Open | Bilodeau Wayne P | $45,200 | |
| Open | Bilodeau Wayne P | $187,000 | |
| Closed | Bilodeau Wayne P | $152,000 |
Source: Public Records
Tax History Compared to Growth
Tax History
| Year | Tax Paid | Tax Assessment Tax Assessment Total Assessment is a certain percentage of the fair market value that is determined by local assessors to be the total taxable value of land and additions on the property. | Land | Improvement |
|---|---|---|---|---|
| 2025 | $8,393 | $709,500 | $196,300 | $513,200 |
| 2024 | $8,089 | $666,300 | $186,900 | $479,400 |
| 2023 | $6,868 | $534,900 | $174,700 | $360,200 |
| 2022 | $6,745 | $471,000 | $153,300 | $317,700 |
| 2021 | $6,342 | $438,000 | $136,800 | $301,200 |
| 2020 | $6,203 | $421,100 | $131,600 | $289,500 |
| 2019 | $6,046 | $407,700 | $131,600 | $276,100 |
| 2018 | $5,783 | $380,700 | $121,700 | $259,000 |
| 2017 | $7,459 | $353,400 | $121,700 | $231,700 |
| 2016 | $5,270 | $339,100 | $119,300 | $219,800 |
| 2015 | $5,297 | $326,200 | $115,800 | $210,400 |
| 2014 | $5,190 | $319,400 | $112,400 | $207,000 |
Source: Public Records
Map
Nearby Homes
- 0 Three Rivers Dr
- 81 Arrowhead Dr
- 114 Plain St
- 163 Hayward St Unit 163
- Lot 1 Mill St
- 225 Whitman St
- 23 Stone Meadow Dr
- 67 Country Dr
- 865 Plymouth St Unit 865
- 10 Eliab Latham Way
- 24 High Pond Dr
- 398 Plymouth St
- 96 Trailwood Dr
- 580 Broad St Unit 1
- 580 Broad St Unit 2
- 590 Bedford St
- 261 Plymouth St
- 1993 Washington St
- 1 Robins St Unit 1
- 317 Water St