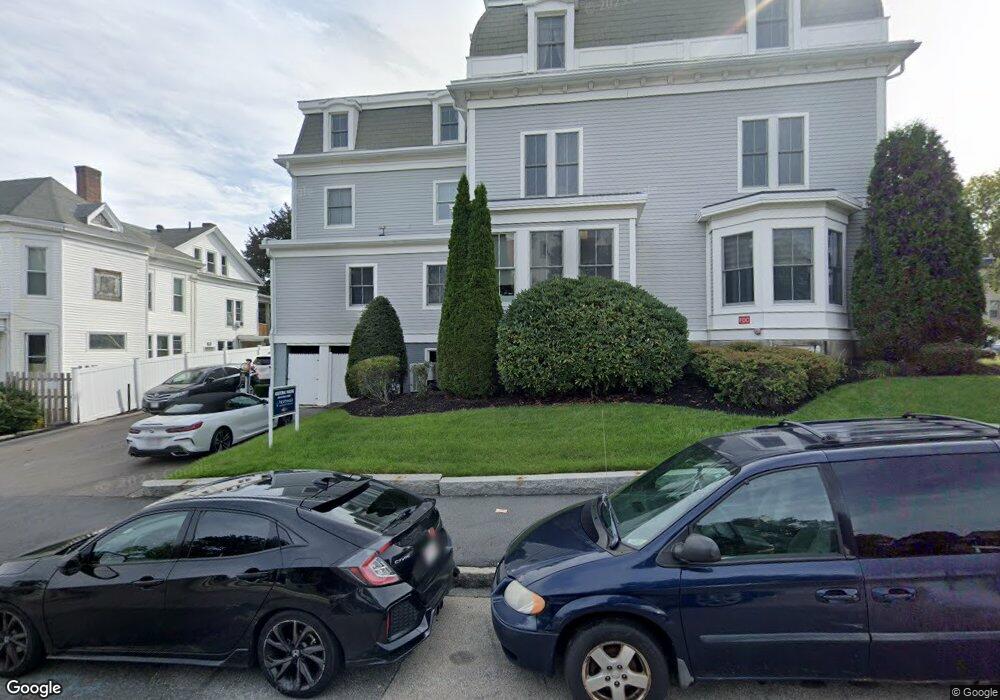
65 Elm St Worcester, MA 01609
Elm Park NeighborhoodEstimated Value: $3,528,126
Studio
--
Bath
8,227
Sq Ft
$429/Sq Ft
Est. Value
About This Home
This home is located at 65 Elm St, Worcester, MA 01609 and is currently estimated at $3,528,126, approximately $428 per square foot. 65 Elm St is a home located in Worcester County with nearby schools including Jacob Hiatt Magnet School, Chandler Magnet, and Elm Park Elementary School.
Ownership History
Date
Name
Owned For
Owner Type
Purchase Details
Closed on
Aug 26, 2021
Sold by
R & O Properties Llc
Bought by
C & D Group Llc
Current Estimated Value
Home Financials for this Owner
Home Financials are based on the most recent Mortgage that was taken out on this home.
Original Mortgage
$1,995,000
Outstanding Balance
$1,815,302
Interest Rate
2.8%
Mortgage Type
Purchase Money Mortgage
Estimated Equity
$1,712,824
Purchase Details
Closed on
Jul 3, 2007
Sold by
4H Realty Llc
Bought by
R&O Property Llc
Purchase Details
Closed on
Apr 27, 2005
Sold by
Herlihy James J and Herlihy Mary C
Bought by
4 H Rlty Llc
Create a Home Valuation Report for This Property
The Home Valuation Report is an in-depth analysis detailing your home's value as well as a comparison with similar homes in the area
Home Values in the Area
Average Home Value in this Area
Purchase History
| Date | Buyer | Sale Price | Title Company |
|---|---|---|---|
| C & D Group Llc | $2,850,000 | None Available | |
| R&O Property Llc | $667,500 | -- | |
| 4 H Rlty Llc | -- | -- | |
| Herlihy James J | -- | -- |
Source: Public Records
Mortgage History
| Date | Status | Borrower | Loan Amount |
|---|---|---|---|
| Open | C & D Group Llc | $1,995,000 |
Source: Public Records
Tax History
| Year | Tax Paid | Tax Assessment Tax Assessment Total Assessment is a certain percentage of the fair market value that is determined by local assessors to be the total taxable value of land and additions on the property. | Land | Improvement |
|---|---|---|---|---|
| 2025 | -- | $1,434,100 | $406,100 | $1,028,000 |
| 2024 | -- | $1,233,700 | $406,100 | $827,600 |
| 2023 | $0 | $1,283,100 | $353,200 | $929,900 |
| 2022 | $0 | $812,200 | $353,200 | $459,000 |
| 2021 | $0 | $680,000 | $268,800 | $411,200 |
| 2020 | $19,659 | $667,300 | $268,800 | $398,500 |
| 2019 | $0 | $648,000 | $261,700 | $386,300 |
| 2018 | $0 | $631,100 | $261,700 | $369,400 |
| 2017 | $0 | $631,100 | $261,700 | $369,400 |
| 2016 | -- | $598,400 | $230,600 | $367,800 |
| 2015 | -- | $598,400 | $230,600 | $367,800 |
| 2014 | $14,119 | $598,400 | $230,600 | $367,800 |
Source: Public Records
Map
Nearby Homes
- 56 Elm St Unit 2
- 13 West St
- 14 Ashland St Unit 2R
- 21 Fruit St
- 29 William St Unit 22
- 10 Congress St Unit 7
- 38 1/2 Bowdoin St
- 34 Elm St
- 3 Marston Way
- 6 Pelham St
- 60 Fruit St
- 15 Goulding St
- 17 Federal St Unit 210
- 531 Main St Unit 410
- 531 Main St Unit 403
- 46 Townsend St
- 12 Winslow St
- 146 -152 Chandler
- 9 Dover St
- 70 Southbridge St Unit 611
Your Personal Tour Guide
Ask me questions while you tour the home.