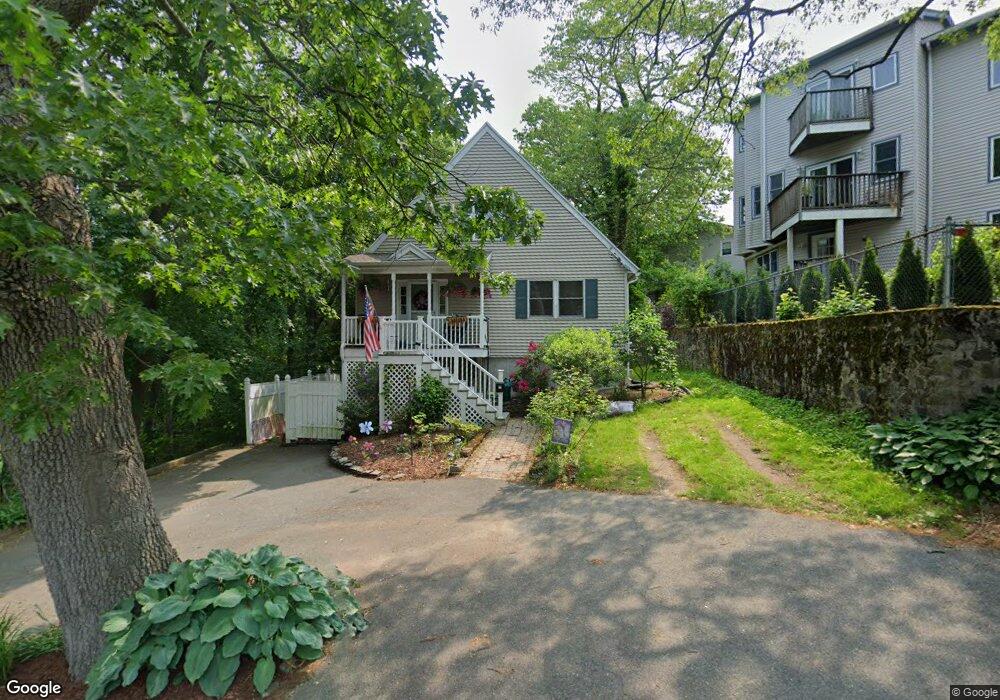
65 Foster Rd Swampscott, MA 01907
Estimated Value: $669,751 - $805,000
2
Beds
2
Baths
1,764
Sq Ft
$414/Sq Ft
Est. Value
About This Home
This home is located at 65 Foster Rd, Swampscott, MA 01907 and is currently estimated at $729,438, approximately $413 per square foot. 65 Foster Rd is a home located in Essex County with nearby schools including Swampscott Middle School, Swampscott High School, and St. Pius V. School.
Ownership History
Date
Name
Owned For
Owner Type
Purchase Details
Closed on
Aug 4, 2011
Sold by
Carey Richard I and Murack Jennie
Bought by
Porter Catherine R
Current Estimated Value
Home Financials for this Owner
Home Financials are based on the most recent Mortgage that was taken out on this home.
Original Mortgage
$238,400
Outstanding Balance
$147,523
Interest Rate
4.51%
Mortgage Type
Purchase Money Mortgage
Estimated Equity
$581,915
Purchase Details
Closed on
Aug 13, 2008
Sold by
Mahoney Jessica B and Mahoney Joshua W
Bought by
Murack Jennie and Carey Richard I
Home Financials for this Owner
Home Financials are based on the most recent Mortgage that was taken out on this home.
Original Mortgage
$313,000
Interest Rate
6.4%
Mortgage Type
Purchase Money Mortgage
Purchase Details
Closed on
Oct 30, 2003
Sold by
Battani Robert H
Bought by
Mahoney Jessica B and Mahoney Joshua W
Home Financials for this Owner
Home Financials are based on the most recent Mortgage that was taken out on this home.
Original Mortgage
$100,100
Interest Rate
6.05%
Mortgage Type
Purchase Money Mortgage
Purchase Details
Closed on
Aug 30, 1994
Sold by
Mcmullen Lauren E
Bought by
Battani Robert H
Create a Home Valuation Report for This Property
The Home Valuation Report is an in-depth analysis detailing your home's value as well as a comparison with similar homes in the area
Home Values in the Area
Average Home Value in this Area
Purchase History
| Date | Buyer | Sale Price | Title Company |
|---|---|---|---|
| Porter Catherine R | $300,000 | -- | |
| Porter Catherine R | $300,000 | -- | |
| Murack Jennie | $340,000 | -- | |
| Murack Jennie | $340,000 | -- | |
| Murack Jennie | $340,000 | -- | |
| Mahoney Jessica B | $298,650 | -- | |
| Mahoney Jessica B | $298,650 | -- | |
| Battani Robert H | $176,000 | -- | |
| Battani Robert H | $176,000 | -- | |
| Battani Robert H | $176,000 | -- |
Source: Public Records
Mortgage History
| Date | Status | Borrower | Loan Amount |
|---|---|---|---|
| Open | Porter Catherine R | $238,400 | |
| Closed | Battani Robert H | $238,400 | |
| Previous Owner | Murack Jennie | $313,000 | |
| Previous Owner | Mahoney Jessica B | $100,100 |
Source: Public Records
Tax History Compared to Growth
Tax History
| Year | Tax Paid | Tax Assessment Tax Assessment Total Assessment is a certain percentage of the fair market value that is determined by local assessors to be the total taxable value of land and additions on the property. | Land | Improvement |
|---|---|---|---|---|
| 2025 | $6,629 | $577,900 | $209,500 | $368,400 |
| 2024 | $6,462 | $562,400 | $199,600 | $362,800 |
| 2023 | $6,321 | $538,400 | $199,600 | $338,800 |
| 2022 | $6,105 | $475,800 | $170,000 | $305,800 |
| 2021 | $5,734 | $415,500 | $133,000 | $282,500 |
| 2020 | $5,942 | $415,500 | $133,000 | $282,500 |
| 2019 | $5,917 | $389,300 | $118,300 | $271,000 |
| 2018 | $5,814 | $363,400 | $103,500 | $259,900 |
| 2017 | $5,996 | $343,600 | $96,100 | $247,500 |
| 2016 | $5,826 | $336,200 | $88,700 | $247,500 |
| 2015 | $5,766 | $336,200 | $88,700 | $247,500 |
| 2014 | $5,709 | $305,300 | $73,900 | $231,400 |
Source: Public Records
Map
Nearby Homes
- 100 Burpee Rd
- 9 Sampson Ave
- 44 Cherry St Unit 2
- 76 Stetson Ave
- 44 Valley Rd
- 25 E Park Ave
- 29-31 Essex Ave Unit 2
- 106 Norfolk Ave
- 51 Barnstable St
- 80 Norfolk Ave Unit 1
- 59 Essex St Unit 59B
- 189 Burrill St Unit 2
- 2 Gracie Ln Unit 4
- 31 Madison St
- 98 Paradise Rd
- 10-12 Fairview Ave
- 35 Columbia Ave
- 133 Eastern Ave Unit 8
- 8 Ryan Place
- 30 Paradise Rd