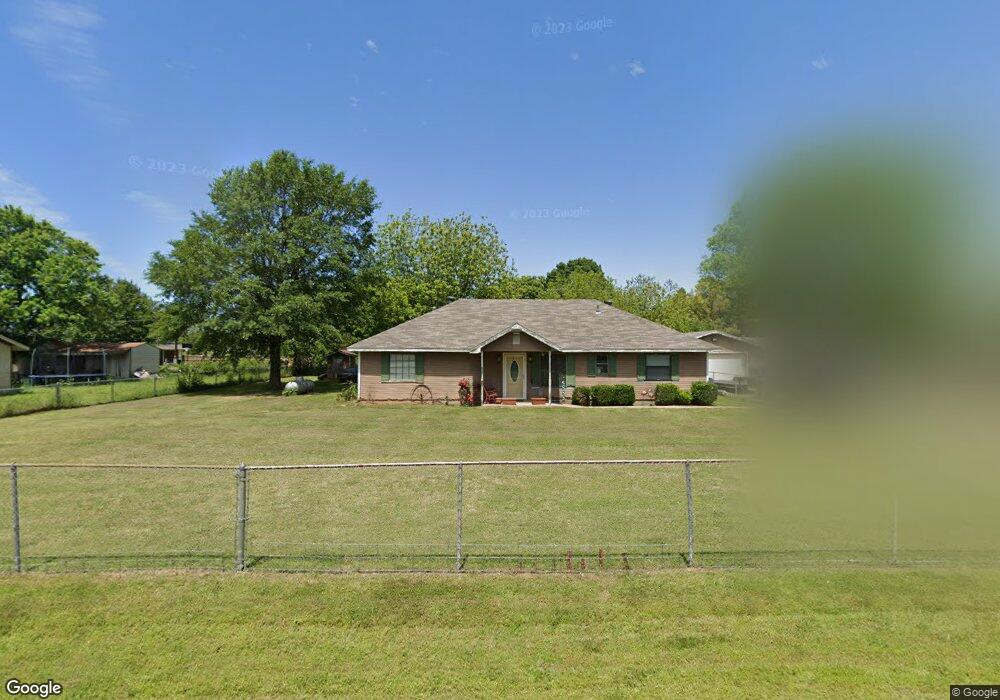
65 Galley Dr Denison, TX 75021
Estimated Value: $183,232 - $246,000
--
Bed
--
Bath
1,455
Sq Ft
$148/Sq Ft
Est. Value
About This Home
This home is located at 65 Galley Dr, Denison, TX 75021 and is currently estimated at $214,616, approximately $147 per square foot. 65 Galley Dr is a home located in Grayson County with nearby schools including Terrell Elementary School, Scott Middle School, and Denison High School.
Ownership History
Date
Name
Owned For
Owner Type
Purchase Details
Closed on
Dec 13, 2006
Sold by
Henshaw Mark Allen
Bought by
Griffin Raymond Earl and Griffin Angela Dawn
Current Estimated Value
Home Financials for this Owner
Home Financials are based on the most recent Mortgage that was taken out on this home.
Original Mortgage
$76,794
Outstanding Balance
$45,888
Interest Rate
6.3%
Mortgage Type
Purchase Money Mortgage
Estimated Equity
$168,728
Create a Home Valuation Report for This Property
The Home Valuation Report is an in-depth analysis detailing your home's value as well as a comparison with similar homes in the area
Home Values in the Area
Average Home Value in this Area
Purchase History
| Date | Buyer | Sale Price | Title Company |
|---|---|---|---|
| Griffin Raymond Earl | -- | Grayson County Title |
Source: Public Records
Mortgage History
| Date | Status | Borrower | Loan Amount |
|---|---|---|---|
| Open | Griffin Raymond Earl | $76,794 |
Source: Public Records
Tax History Compared to Growth
Tax History
| Year | Tax Paid | Tax Assessment Tax Assessment Total Assessment is a certain percentage of the fair market value that is determined by local assessors to be the total taxable value of land and additions on the property. | Land | Improvement |
|---|---|---|---|---|
| 2025 | $2,064 | $128,922 | $14,496 | $114,426 |
| 2024 | $2,064 | $127,775 | $10,009 | $117,766 |
| 2023 | $2,030 | $125,500 | $10,009 | $115,491 |
| 2022 | $1,931 | $111,748 | $10,009 | $101,739 |
| 2021 | $1,668 | $88,978 | $8,340 | $80,638 |
| 2020 | $1,811 | $90,963 | $8,340 | $82,623 |
| 2019 | $2,085 | $98,165 | $8,340 | $89,825 |
| 2018 | $2,008 | $93,566 | $8,340 | $85,226 |
| 2017 | $2,045 | $94,671 | $8,340 | $86,331 |
| 2016 | $1,271 | $58,833 | $5,943 | $52,890 |
| 2015 | $949 | $43,557 | $6,317 | $37,240 |
| 2014 | $1,141 | $52,368 | $5,818 | $46,550 |
Source: Public Records
Map
Nearby Homes
- 489 Delphia Dr
- 4336 Carpenters Bluff Rd
- 725 Carpenters Bluff Rd
- 1988 Elmore Rd
- 320 Elmore Rd
- 1700 Elmore Rd
- 0000 Carpenters Bluff Rd
- 4489 E Fm 120
- 115 N Main St
- 4489 E Farm To Market 120
- 000 E2250 Rd
- 598 Stagecoach Trail
- 3091 E Fm 120
- 4822 Fm 1753
- 1860 W Bumpass Rd
- TBD E Fm 120
- TBD Singletree Rd
- 2550 Farm To Market Road 120
- 6091 Fm 1753
- 5994 Fm 1753