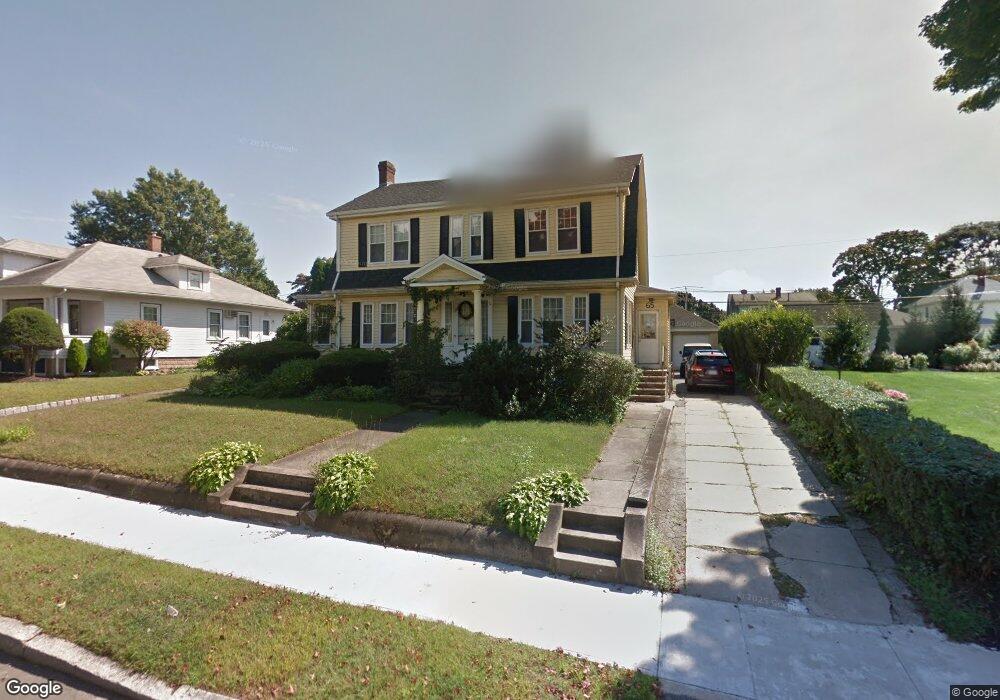
65 Gardner St Peabody, MA 01960
Peabody Town Center NeighborhoodEstimated Value: $657,000 - $726,000
3
Beds
3
Baths
1,856
Sq Ft
$377/Sq Ft
Est. Value
About This Home
This home is located at 65 Gardner St, Peabody, MA 01960 and is currently estimated at $699,550, approximately $376 per square foot. 65 Gardner St is a home located in Essex County with nearby schools including Peabody Veterans Memorial High School, St John The Baptist School, and The Phoenix School.
Ownership History
Date
Name
Owned For
Owner Type
Purchase Details
Closed on
Nov 5, 2012
Sold by
Coelho Anna K and Coelho Caros J
Bought by
Coelho Carlos J
Current Estimated Value
Home Financials for this Owner
Home Financials are based on the most recent Mortgage that was taken out on this home.
Original Mortgage
$160,000
Outstanding Balance
$109,553
Interest Rate
3.5%
Mortgage Type
New Conventional
Estimated Equity
$589,997
Purchase Details
Closed on
Jul 22, 1994
Sold by
Coelho Agostinho C
Bought by
Batista-Coelho Anna K and Coelho Carlos Jc
Create a Home Valuation Report for This Property
The Home Valuation Report is an in-depth analysis detailing your home's value as well as a comparison with similar homes in the area
Home Values in the Area
Average Home Value in this Area
Purchase History
| Date | Buyer | Sale Price | Title Company |
|---|---|---|---|
| Coelho Carlos J | $180,000 | -- | |
| Batista-Coelho Anna K | $150,000 | -- |
Source: Public Records
Mortgage History
| Date | Status | Borrower | Loan Amount |
|---|---|---|---|
| Open | Batista-Coelho Anna K | $160,000 |
Source: Public Records
Tax History
| Year | Tax Paid | Tax Assessment Tax Assessment Total Assessment is a certain percentage of the fair market value that is determined by local assessors to be the total taxable value of land and additions on the property. | Land | Improvement |
|---|---|---|---|---|
| 2025 | $5,615 | $606,400 | $218,700 | $387,700 |
| 2024 | $5,262 | $577,000 | $218,700 | $358,300 |
| 2023 | $5,101 | $535,800 | $195,300 | $340,500 |
| 2022 | $4,530 | $448,500 | $174,400 | $274,100 |
| 2021 | $4,537 | $432,500 | $158,600 | $273,900 |
| 2020 | $4,601 | $428,400 | $158,600 | $269,800 |
| 2019 | $4,348 | $394,900 | $158,600 | $236,300 |
| 2018 | $4,255 | $371,300 | $144,100 | $227,200 |
| 2017 | $3,930 | $334,200 | $144,100 | $190,100 |
| 2016 | $3,863 | $324,100 | $144,100 | $180,000 |
| 2015 | $3,654 | $297,100 | $140,500 | $156,600 |
Source: Public Records
Map
Nearby Homes
- 41 Northend St
- 30 Driscoll St
- 16 Tremont St
- 9 Highland St
- 11 A Endicott St Unit 3
- 16 Oakland St
- 46 Walnut St
- 0 Buttonwood Ln Unit 2
- 75 Walnut St Unit 315
- 8 Crowninshield St Unit 410
- 28 Sabino Farm Rd
- 10 Crowninshield St Unit 303
- 10 Park St
- 48 Franklin St
- 6 Rear Perkins St
- 158 Lowell St Unit 4
- 64 Foster St Unit 105
- 80 Foster St Unit 501
- 5 Orchard St
- 145 Boston St
Your Personal Tour Guide
Ask me questions while you tour the home.