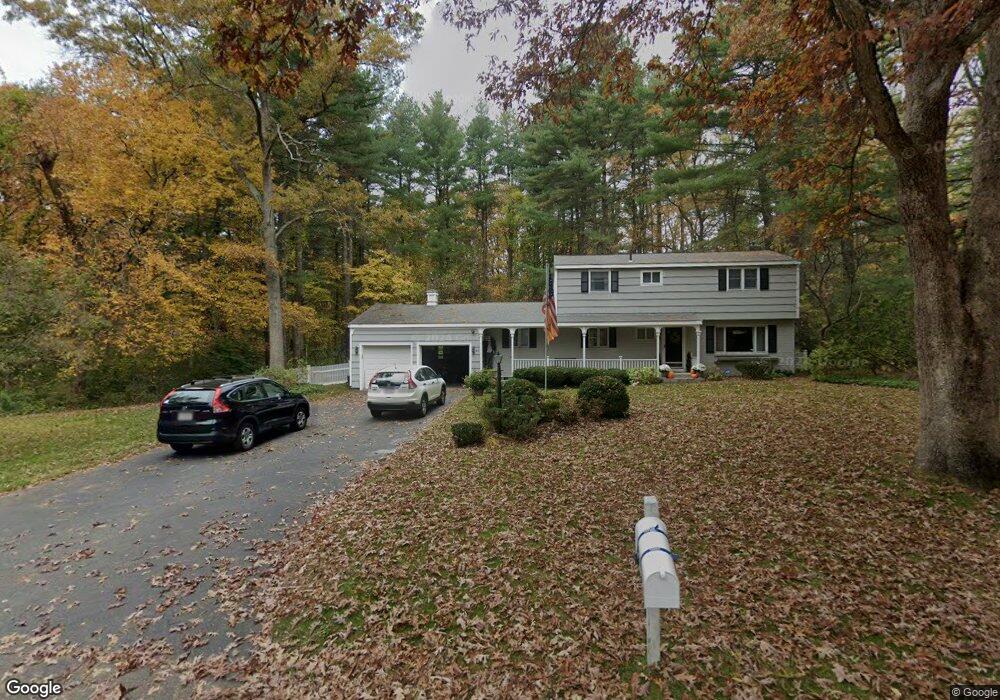
65 Hemlock Rd Sudbury, MA 01776
Estimated Value: $869,337 - $1,007,000
3
Beds
2
Baths
1,792
Sq Ft
$520/Sq Ft
Est. Value
About This Home
This home is located at 65 Hemlock Rd, Sudbury, MA 01776 and is currently estimated at $932,334, approximately $520 per square foot. 65 Hemlock Rd is a home located in Middlesex County with nearby schools including Peter Noyes Elementary School, Ephraim Curtis Middle School, and Lincoln-Sudbury Regional High School.
Ownership History
Date
Name
Owned For
Owner Type
Purchase Details
Closed on
Aug 27, 2010
Sold by
Silverman Stephen and Silverman Rhonda
Bought by
Burge Timothy J and Burge Lisa A
Current Estimated Value
Home Financials for this Owner
Home Financials are based on the most recent Mortgage that was taken out on this home.
Original Mortgage
$404,000
Outstanding Balance
$268,529
Interest Rate
4.57%
Mortgage Type
Purchase Money Mortgage
Estimated Equity
$663,805
Create a Home Valuation Report for This Property
The Home Valuation Report is an in-depth analysis detailing your home's value as well as a comparison with similar homes in the area
Home Values in the Area
Average Home Value in this Area
Purchase History
| Date | Buyer | Sale Price | Title Company |
|---|---|---|---|
| Burge Timothy J | $505,000 | -- |
Source: Public Records
Mortgage History
| Date | Status | Borrower | Loan Amount |
|---|---|---|---|
| Open | Burge Timothy J | $404,000 |
Source: Public Records
Tax History Compared to Growth
Tax History
| Year | Tax Paid | Tax Assessment Tax Assessment Total Assessment is a certain percentage of the fair market value that is determined by local assessors to be the total taxable value of land and additions on the property. | Land | Improvement |
|---|---|---|---|---|
| 2025 | $11,252 | $768,600 | $424,600 | $344,000 |
| 2024 | $10,861 | $743,400 | $412,200 | $331,200 |
| 2023 | $10,801 | $684,900 | $381,700 | $303,200 |
| 2022 | $10,131 | $561,300 | $350,300 | $211,000 |
| 2021 | $9,803 | $520,600 | $350,300 | $170,300 |
| 2020 | $9,605 | $520,600 | $350,300 | $170,300 |
| 2019 | $9,324 | $520,600 | $350,300 | $170,300 |
| 2018 | $9,275 | $517,300 | $373,500 | $143,800 |
| 2017 | $8,687 | $489,700 | $355,300 | $134,400 |
| 2016 | $8,448 | $474,600 | $341,800 | $132,800 |
| 2015 | $7,955 | $452,000 | $328,600 | $123,400 |
| 2014 | $7,921 | $439,300 | $319,000 | $120,300 |
Source: Public Records
Map
Nearby Homes