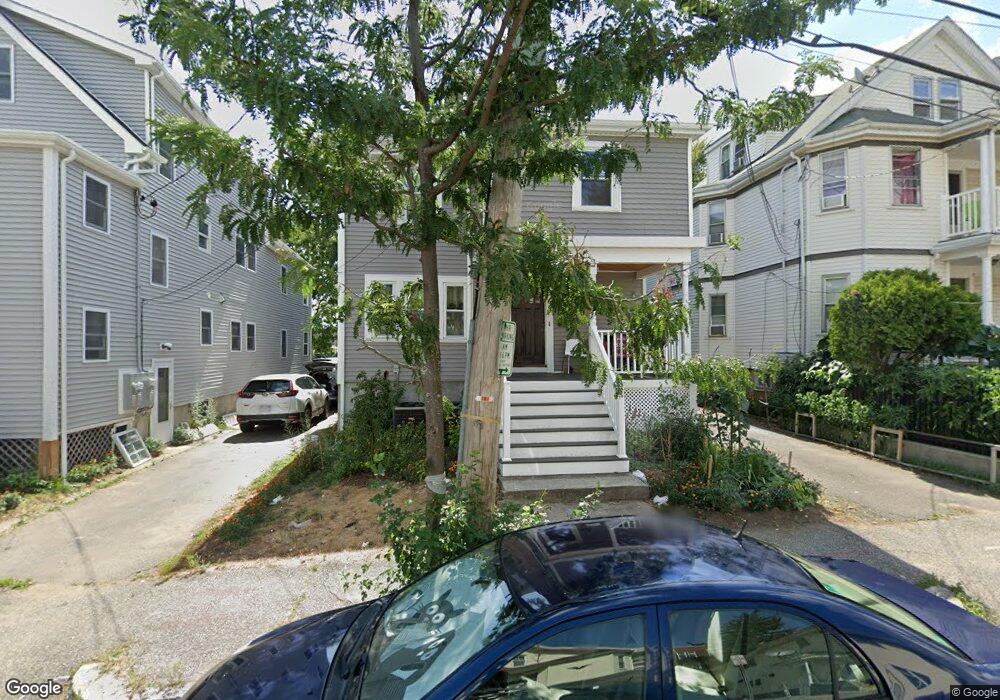
65 Holmes St Quincy, MA 02171
Montclair NeighborhoodEstimated Value: $1,021,000 - $1,328,000
6
Beds
4
Baths
2,984
Sq Ft
$391/Sq Ft
Est. Value
About This Home
This home is located at 65 Holmes St, Quincy, MA 02171 and is currently estimated at $1,166,834, approximately $391 per square foot. 65 Holmes St is a home located in Norfolk County with nearby schools including Montclair Elementary School, Atlantic Middle School, and North Quincy High School.
Ownership History
Date
Name
Owned For
Owner Type
Purchase Details
Closed on
Oct 23, 2024
Sold by
Guan Lin Q and Lin Xiu Y
Bought by
Leaguan Llc
Current Estimated Value
Purchase Details
Closed on
Jun 23, 2016
Sold by
Guan Lin Q
Bought by
Guan Lin Q and Lin Xiu Y
Purchase Details
Closed on
Nov 3, 2014
Sold by
Lysakowski Henry W
Bought by
65 Holmes Street Rt and Lysakowski
Purchase Details
Closed on
Jun 3, 2013
Sold by
Lysakowski Henry W and Lysakowski Virginia M
Bought by
Lysakowski Henry W
Create a Home Valuation Report for This Property
The Home Valuation Report is an in-depth analysis detailing your home's value as well as a comparison with similar homes in the area
Home Values in the Area
Average Home Value in this Area
Purchase History
| Date | Buyer | Sale Price | Title Company |
|---|---|---|---|
| Leaguan Llc | -- | None Available | |
| Leaguan Llc | -- | None Available | |
| Guan Lin Q | -- | -- | |
| Guan Lin Q | -- | -- | |
| 65 Holmes Street Rt | -- | -- | |
| 65 Holmes Street Rt | -- | -- | |
| Lysakowski Henry W | -- | -- | |
| Lysakowski Henry W | -- | -- |
Source: Public Records
Mortgage History
| Date | Status | Borrower | Loan Amount |
|---|---|---|---|
| Previous Owner | Lysakowski Henry W | $22,000 | |
| Previous Owner | Lysakowski Henry W | $10,000 |
Source: Public Records
Tax History
| Year | Tax Paid | Tax Assessment Tax Assessment Total Assessment is a certain percentage of the fair market value that is determined by local assessors to be the total taxable value of land and additions on the property. | Land | Improvement |
|---|---|---|---|---|
| 2025 | $12,991 | $1,126,700 | $328,900 | $797,800 |
| 2024 | $12,388 | $1,099,200 | $328,900 | $770,300 |
| 2023 | $10,724 | $963,500 | $313,300 | $650,200 |
| 2022 | $9,996 | $834,400 | $272,400 | $562,000 |
| 2021 | $9,646 | $794,600 | $259,500 | $535,100 |
| 2020 | $5,703 | $458,800 | $259,500 | $199,300 |
| 2019 | $5,435 | $433,100 | $242,500 | $190,600 |
| 2018 | $5,353 | $401,300 | $224,500 | $176,800 |
| 2017 | $5,244 | $370,100 | $213,800 | $156,300 |
| 2016 | $4,780 | $332,900 | $185,900 | $147,000 |
| 2015 | $4,441 | $304,200 | $169,000 | $135,200 |
| 2014 | $4,219 | $283,900 | $161,000 | $122,900 |
Source: Public Records
Map
Nearby Homes
- 17 Holmes St Unit 204
- 17 Holmes St Unit 2
- 17 Holmes St Unit 1
- 39 Fayette St Unit 403
- 98 Safford St
- 85 E Squantum St Unit 10
- 52 Hamilton Ave
- 10 Weston Ave Unit 322
- 20 Ellington Rd
- 154 N Central Ave
- 28 Apthorp St
- 70 Walnut St
- 201 Billings St
- 43 Hilma St
- 133 Commander Shea Blvd Unit 502
- 133 Commander Shea Blvd Unit 203
- 133 Commander Shea Blvd Unit 709
- 297 Billings St
- 90 Quincy Shore Dr Unit 701
- 90 Quincy Shore Dr Unit 501
- 63 Holmes St
- 2 Billings Rd
- 73 Holmes St
- 61 Holmes St
- 67 Holmes St
- 0000 Billings Rd
- 000 Billings Rd
- 69 Holmes St Unit 2
- 69 Holmes St Unit 1
- 69 Holmes St
- 69 Holmes St Unit 73
- 69 Holmes St Unit 69
- 71 Holmes St
- 59 Holmes St
- 70 Holmes St
- 16 Billings Rd
- 16 Billings Rd Unit 2
- 16 Billings Rd Unit 2nd Floor
- 16 Billings Rd Unit 1
- 16 Billings Rd Unit B
Your Personal Tour Guide
Ask me questions while you tour the home.