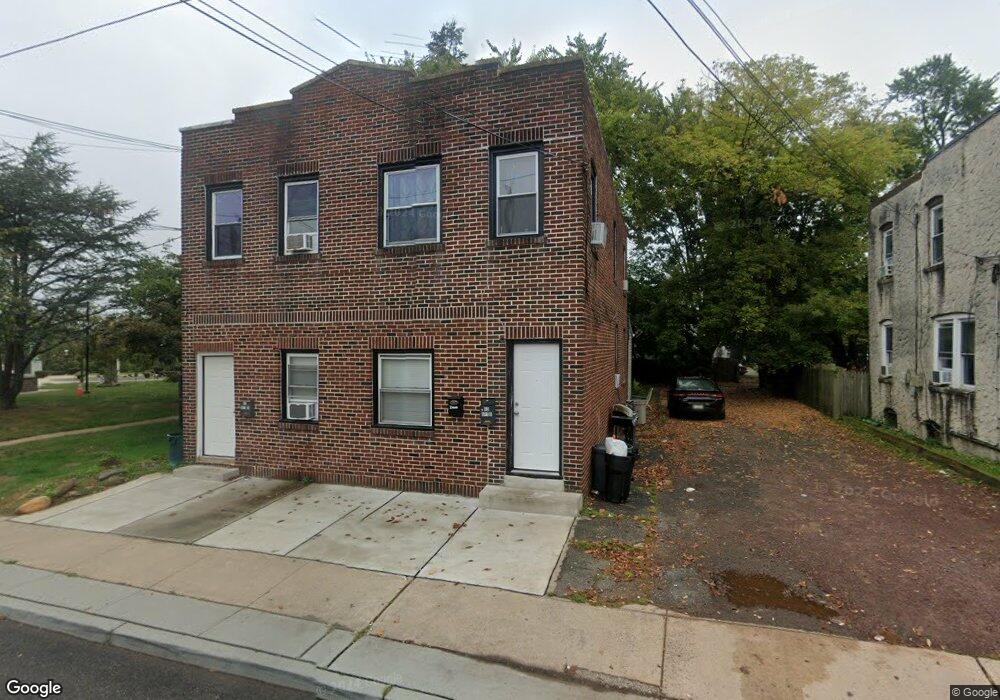
65 Main St Matawan, NJ 07747
Estimated Value: $518,000 - $589,000
5
Beds
3
Baths
1,820
Sq Ft
$306/Sq Ft
Est. Value
About This Home
This home is located at 65 Main St, Matawan, NJ 07747 and is currently estimated at $556,370, approximately $305 per square foot. 65 Main St is a home located in Monmouth County with nearby schools including Matawan Reg High School, St. Joseph Elementary School, and Icob Academy.
Ownership History
Date
Name
Owned For
Owner Type
Purchase Details
Closed on
Aug 31, 2020
Sold by
Impaglia John
Bought by
65 Main St Matawan Llc
Current Estimated Value
Home Financials for this Owner
Home Financials are based on the most recent Mortgage that was taken out on this home.
Original Mortgage
$246,500
Interest Rate
2.8%
Mortgage Type
New Conventional
Purchase Details
Closed on
Jul 14, 1982
Bought by
Impaglia John
Create a Home Valuation Report for This Property
The Home Valuation Report is an in-depth analysis detailing your home's value as well as a comparison with similar homes in the area
Home Values in the Area
Average Home Value in this Area
Purchase History
| Date | Buyer | Sale Price | Title Company |
|---|---|---|---|
| 65 Main St Matawan Llc | $290,000 | First American Title | |
| Impaglia John | $35,300 | -- |
Source: Public Records
Mortgage History
| Date | Status | Borrower | Loan Amount |
|---|---|---|---|
| Previous Owner | 65 Main St Matawan Llc | $246,500 |
Source: Public Records
Tax History
| Year | Tax Paid | Tax Assessment Tax Assessment Total Assessment is a certain percentage of the fair market value that is determined by local assessors to be the total taxable value of land and additions on the property. | Land | Improvement |
|---|---|---|---|---|
| 2025 | $7,811 | $499,700 | $289,400 | $210,300 |
| 2024 | $7,452 | $357,800 | $190,400 | $167,400 |
| 2023 | $7,452 | $342,800 | $181,400 | $161,400 |
| 2022 | $6,412 | $249,600 | $95,900 | $153,700 |
| 2021 | $4,839 | $236,000 | $95,900 | $140,100 |
| 2020 | $6,534 | $238,800 | $100,400 | $138,400 |
| 2019 | $6,055 | $221,800 | $86,900 | $134,900 |
| 2018 | $5,858 | $211,100 | $77,900 | $133,200 |
| 2017 | $5,239 | $186,100 | $55,400 | $130,700 |
| 2016 | $5,330 | $193,400 | $64,400 | $129,000 |
| 2015 | $5,886 | $215,200 | $91,400 | $123,800 |
| 2014 | $6,349 | $233,000 | $104,900 | $128,100 |
Source: Public Records
Map
Nearby Homes
- 68 Main St
- 10 Johnson Ave
- 259 Matawan Ave
- 9 Fountain Ave
- 49 Lucia Ct
- 3 Harrison Ave
- 207 Lower Main St
- 255 Harding Blvd
- 190 Jackson St
- 154 Lower Main St
- 65 Ravine Dr
- 3 Noble Place
- 101 Ravine Dr
- 272 Main St
- 258 Jackson St
- 97D Aberdeen Rd
- 55 Lower Main St
- 45 Beechwood Terrace
- 11 Anton Place
- 227 W Prospect Ave
Your Personal Tour Guide
Ask me questions while you tour the home.