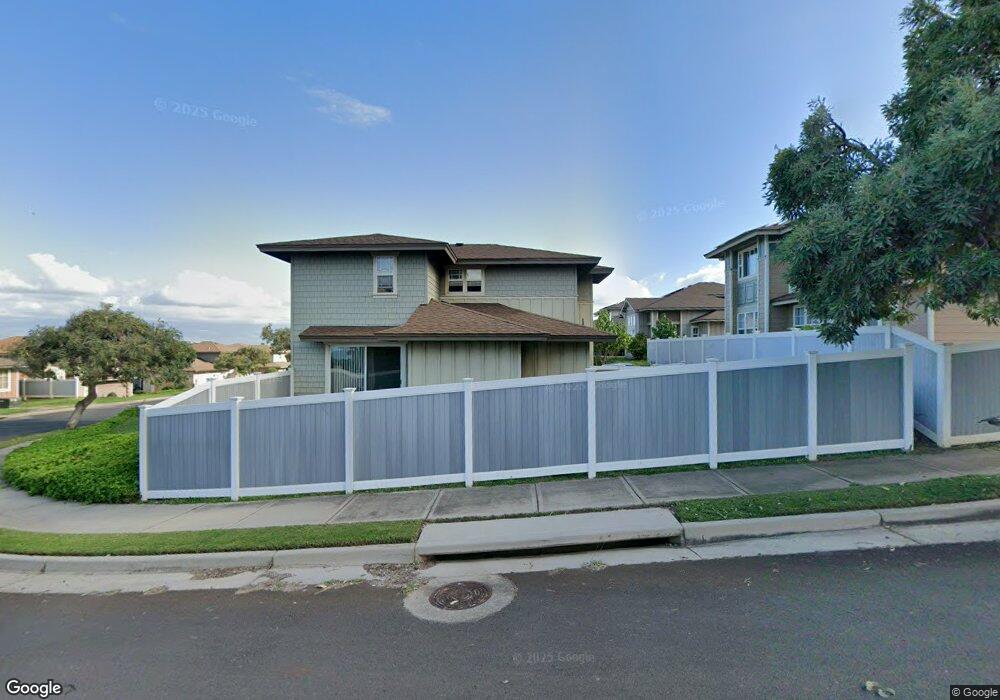
65 Maka Hou Loop Unit 74 Wailuku, HI 96793
Estimated Value: $1,198,000 - $1,276,359
3
Beds
3
Baths
1,633
Sq Ft
$755/Sq Ft
Est. Value
About This Home
This home is located at 65 Maka Hou Loop Unit 74, Wailuku, HI 96793 and is currently estimated at $1,232,590, approximately $754 per square foot. 65 Maka Hou Loop Unit 74 is a home located in Maui County with nearby schools including Puu Kukui Elementary School, Iao Intermediate School, and Henry Perrine Baldwin High School.
Ownership History
Date
Name
Owned For
Owner Type
Purchase Details
Closed on
Oct 12, 2021
Sold by
Ono Derek T and Ono Kristilee K
Bought by
Ono Derek and Ono Kristilee
Current Estimated Value
Purchase Details
Closed on
May 15, 2013
Sold by
Nakama Grant Tokuo
Bought by
Ono Derek T and Hirata Kristilee K
Home Financials for this Owner
Home Financials are based on the most recent Mortgage that was taken out on this home.
Original Mortgage
$396,000
Outstanding Balance
$279,345
Interest Rate
3.38%
Mortgage Type
New Conventional
Estimated Equity
$953,245
Purchase Details
Closed on
Mar 15, 2010
Sold by
Kehalani 511 Maui Llc
Bought by
Nakama Grant Tokuo
Home Financials for this Owner
Home Financials are based on the most recent Mortgage that was taken out on this home.
Original Mortgage
$368,000
Interest Rate
5%
Mortgage Type
Unknown
Create a Home Valuation Report for This Property
The Home Valuation Report is an in-depth analysis detailing your home's value as well as a comparison with similar homes in the area
Home Values in the Area
Average Home Value in this Area
Purchase History
| Date | Buyer | Sale Price | Title Company |
|---|---|---|---|
| Ono Derek | -- | None Available | |
| Ono Derek T | -- | None Available | |
| Ono Derek T | -- | Fam | |
| Nakama Grant Tokuo | $460,000 | Or |
Source: Public Records
Mortgage History
| Date | Status | Borrower | Loan Amount |
|---|---|---|---|
| Open | Ono Derek T | $396,000 | |
| Previous Owner | Nakama Grant Tokuo | $368,000 |
Source: Public Records
Tax History Compared to Growth
Tax History
| Year | Tax Paid | Tax Assessment Tax Assessment Total Assessment is a certain percentage of the fair market value that is determined by local assessors to be the total taxable value of land and additions on the property. | Land | Improvement |
|---|---|---|---|---|
| 2025 | $1,167 | $1,143,000 | $715,400 | $427,600 |
| 2024 | $1,167 | $948,400 | $541,000 | $407,400 |
| 2023 | $1,001 | $948,600 | $541,000 | $407,600 |
| 2022 | $1,001 | $700,400 | $330,600 | $369,800 |
| 2021 | $1,027 | $626,000 | $300,600 | $325,400 |
| 2020 | $1,115 | $644,100 | $312,600 | $331,500 |
| 2019 | $1,138 | $592,300 | $270,500 | $321,800 |
| 2018 | $1,039 | $564,700 | $204,400 | $360,300 |
| 2017 | $945 | $0 | $0 | $0 |
| 2016 | $883 | $526,900 | $192,400 | $334,500 |
| 2015 | $386 | $494,300 | $192,400 | $301,900 |
Source: Public Records
Map
Nearby Homes
- 33 Kinohi Loa St
- 107 Kinohi Loa St
- 673 Kauna Lipo Dr Unit 18
- 582 Kauna Lipo Dr
- 645 Kauna Lipo Dr
- 563 Kauna Lipo Dr
- 637 Kauna Lipo Dr Unit 14
- 508 Kauna Lipo Dr Unit LOT 39
- 629 Kauna Lipo Dr Unit 13
- 530 Kauna Lipo Dr Unit 36
- 63 Pua Kalaunu Unit Lot 37
- 124 Hopoi Place
- 69 Pua Kalaunu Unit Lot 36
- 116 Hopoi Place Unit 57
- 33 Kokea St Unit 901
- 70 Awela Cir Unit 2601
- 66 Awela Cir Unit 2803
- 41 Kokea St Unit 1003
- 66 Awela Cir Unit 2802
- 125 Hopoi Place Unit Lot 55
- 55 Maka Hou Loop
- 55 Maka Hou Loop Unit 77
- 63 Maka Hou Loop Unit 75
- 63 Maka Hou Loop
- 59 Maka Hou Loop
- 96 Maka Hou Loop
- 64 Maka Hou Loop
- 64 Maka Hou Loop Unit 106
- 78 Maka Hou Loop
- 78 Maka Hou Loop Unit 103
- 39 Maka Hou Loop Unit 78
- 37 Maka Hou Loop Unit Lot 79
- 94 Maka Hou Loop
- 94 Maka Hou Loop Unit 98
- 86 Maka Hou Loop Unit 102
- 56 Maka Hou Loop Unit 107
- 118 Maka Hou Loop Unit 94
- 98 Maka Hou Loop
- 98 Maka Hou Loop Unit 97
- 42 Maka Hou Loop