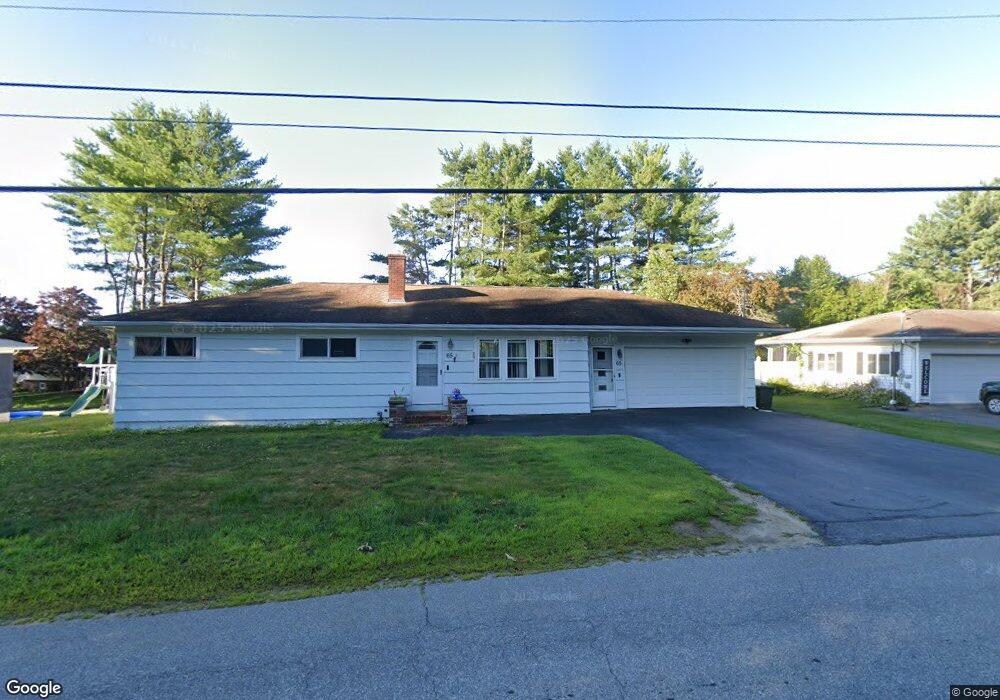
65 Montello St Lewiston, ME 04240
Estimated Value: $293,122 - $315,000
3
Beds
1
Bath
1,144
Sq Ft
$264/Sq Ft
Est. Value
About This Home
This home is located at 65 Montello St, Lewiston, ME 04240 and is currently estimated at $301,531, approximately $263 per square foot. 65 Montello St is a home located in Androscoggin County with nearby schools including Raymond A. Geiger Elementary School, Lewiston High School, and Central Maine Christian Academy.
Ownership History
Date
Name
Owned For
Owner Type
Purchase Details
Closed on
Mar 9, 2017
Sold by
Zhao-Chan Hui Z and Chan Fook K
Bought by
Chan David and Chan Eddie Y
Current Estimated Value
Purchase Details
Closed on
Oct 29, 2015
Sold by
Chan David
Bought by
Chan Hui Z
Purchase Details
Closed on
Aug 25, 2014
Sold by
Chan Hui Z and Chan Fook K
Bought by
Chan David and Chan Hui Z
Create a Home Valuation Report for This Property
The Home Valuation Report is an in-depth analysis detailing your home's value as well as a comparison with similar homes in the area
Home Values in the Area
Average Home Value in this Area
Purchase History
| Date | Buyer | Sale Price | Title Company |
|---|---|---|---|
| Chan David | -- | -- | |
| Chan Hui Z | -- | -- | |
| Chan David | -- | -- |
Source: Public Records
Tax History Compared to Growth
Tax History
| Year | Tax Paid | Tax Assessment Tax Assessment Total Assessment is a certain percentage of the fair market value that is determined by local assessors to be the total taxable value of land and additions on the property. | Land | Improvement |
|---|---|---|---|---|
| 2025 | $3,085 | $94,100 | $20,520 | $73,580 |
| 2024 | $2,990 | $94,100 | $20,520 | $73,580 |
| 2023 | $2,823 | $94,100 | $20,520 | $73,580 |
| 2022 | $2,682 | $94,100 | $20,520 | $73,580 |
| 2021 | $2,659 | $94,100 | $20,520 | $73,580 |
| 2020 | $2,698 | $94,100 | $20,520 | $73,580 |
| 2019 | $2,718 | $94,020 | $20,520 | $73,500 |
| 2018 | $2,696 | $94,020 | $20,520 | $73,500 |
| 2017 | $2,634 | $94,020 | $20,520 | $73,500 |
| 2016 | $2,589 | $94,020 | $20,520 | $73,500 |
| 2015 | $2,573 | $94,020 | $20,520 | $73,500 |
| 2014 | $2,500 | $94,020 | $20,520 | $73,500 |
| 2013 | $2,486 | $94,020 | $20,520 | $73,500 |
Source: Public Records
Map
Nearby Homes