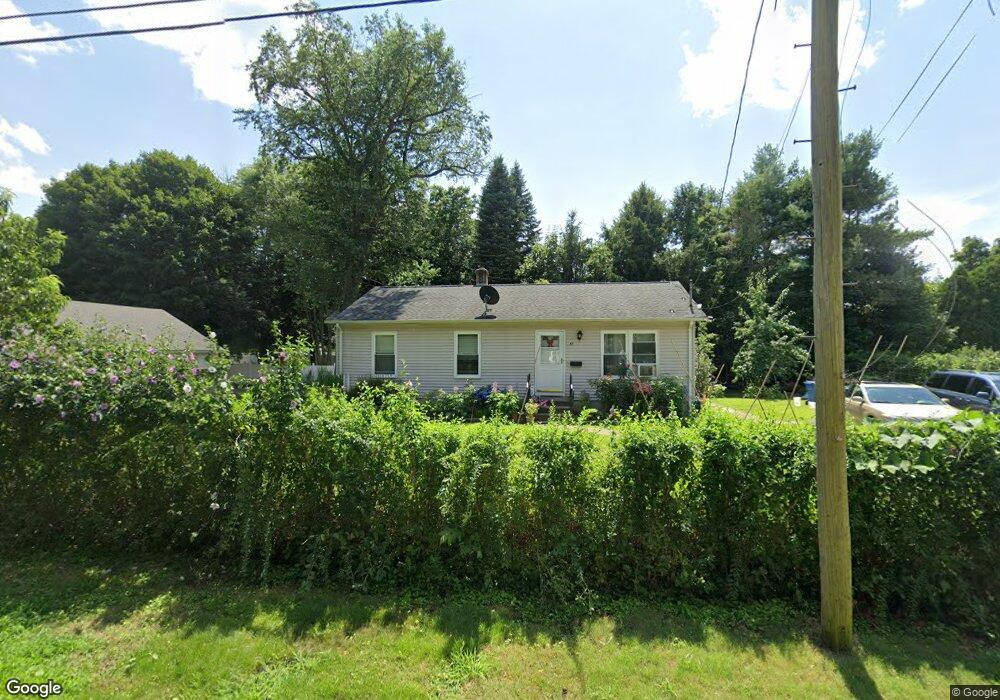
65 Mowry Ave Norwich, CT 06360
Central Norwich NeighborhoodEstimated Value: $248,661 - $328,000
3
Beds
1
Bath
960
Sq Ft
$298/Sq Ft
Est. Value
About This Home
This home is located at 65 Mowry Ave, Norwich, CT 06360 and is currently estimated at $285,665, approximately $297 per square foot. 65 Mowry Ave is a home located in New London County with nearby schools including Veterans' Memorial Elementary School, Kelly STEAM Magnet Middle School, and Integrated Day Charter School.
Ownership History
Date
Name
Owned For
Owner Type
Purchase Details
Closed on
Jun 17, 2010
Sold by
Miller Andrew J and Miller Nancy E
Bought by
He Miaoyun and Auris Wilder A
Current Estimated Value
Home Financials for this Owner
Home Financials are based on the most recent Mortgage that was taken out on this home.
Original Mortgage
$152,900
Outstanding Balance
$105,101
Interest Rate
5.5%
Mortgage Type
FHA
Estimated Equity
$180,564
Purchase Details
Closed on
Dec 11, 1989
Sold by
Harrison Howard
Bought by
Miller Andrew
Home Financials for this Owner
Home Financials are based on the most recent Mortgage that was taken out on this home.
Original Mortgage
$105,050
Interest Rate
9.72%
Mortgage Type
Purchase Money Mortgage
Purchase Details
Closed on
Jul 31, 1987
Sold by
Elrich Corp
Bought by
Harrison Howard E
Home Financials for this Owner
Home Financials are based on the most recent Mortgage that was taken out on this home.
Original Mortgage
$85,000
Interest Rate
10.43%
Mortgage Type
Purchase Money Mortgage
Create a Home Valuation Report for This Property
The Home Valuation Report is an in-depth analysis detailing your home's value as well as a comparison with similar homes in the area
Home Values in the Area
Average Home Value in this Area
Purchase History
| Date | Buyer | Sale Price | Title Company |
|---|---|---|---|
| He Miaoyun | $155,000 | -- | |
| He Miaoyun | $155,000 | -- | |
| Miller Andrew | $116,500 | -- | |
| Harrison Howard E | $96,000 | -- |
Source: Public Records
Mortgage History
| Date | Status | Borrower | Loan Amount |
|---|---|---|---|
| Open | Harrison Howard E | $152,900 | |
| Closed | Harrison Howard E | $152,900 | |
| Previous Owner | Harrison Howard E | $105,050 | |
| Previous Owner | Harrison Howard E | $85,000 |
Source: Public Records
Tax History
| Year | Tax Paid | Tax Assessment Tax Assessment Total Assessment is a certain percentage of the fair market value that is determined by local assessors to be the total taxable value of land and additions on the property. | Land | Improvement |
|---|---|---|---|---|
| 2025 | $5,686 | $140,500 | $39,000 | $101,500 |
| 2024 | $5,367 | $140,500 | $39,000 | $101,500 |
| 2023 | $3,750 | $77,100 | $19,300 | $57,800 |
| 2022 | $3,738 | $77,100 | $19,300 | $57,800 |
| 2021 | $3,750 | $77,100 | $19,300 | $57,800 |
| 2020 | $3,737 | $77,100 | $19,300 | $57,800 |
| 2019 | $3,700 | $77,100 | $19,300 | $57,800 |
| 2018 | $3,721 | $76,900 | $18,200 | $58,700 |
| 2017 | $3,748 | $76,900 | $18,200 | $58,700 |
| 2016 | $3,773 | $76,900 | $18,200 | $58,700 |
| 2015 | $3,436 | $71,500 | $18,200 | $53,300 |
| 2014 | $3,284 | $71,500 | $18,200 | $53,300 |
Source: Public Records
Map
Nearby Homes
- 1 Long Society Rd
- 79 Roosevelt Ave
- 296 Hamilton Ave Unit 30
- 296 Hamilton Ave Unit 25
- 168 Corning Rd
- 540 N Main St
- 303 Central Ave
- 197 Central Ave
- 294 Central Ave
- 47 8th St
- 188 Central Ave
- 0 7th St
- 625 N Main St Unit 627
- 406 Central Ave Unit 408
- 100 7th St
- 113 4th St
- 687 N Main St
- 556 Boswell Ave
- 110 N Main St
- 24 Central Ave
Your Personal Tour Guide
Ask me questions while you tour the home.