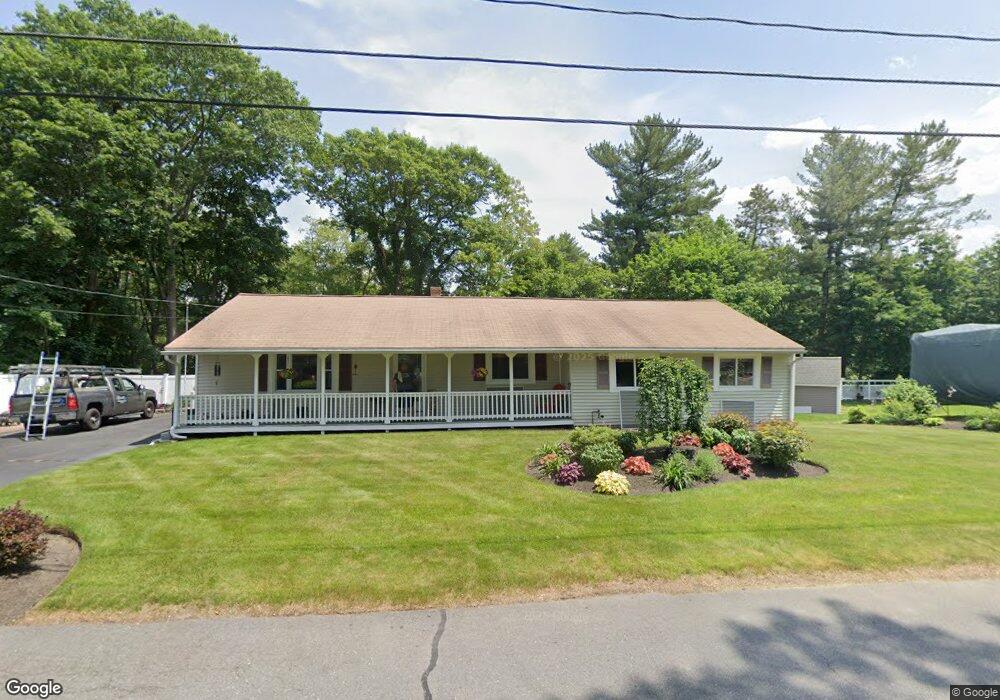
65 Myron St Dracut, MA 01826
Dracut AreaEstimated Value: $544,000 - $641,000
About This Home
This home is located at 65 Myron St, Dracut, MA 01826 and is currently estimated at $596,676, approximately $315 per square foot. 65 Myron St is a home located in Middlesex County with nearby schools including Brookside Elementary School, Richardson Middle School, and Dracut Senior High School.
Ownership History
We collect this data history from publicly available records. To have your information removed, we recommend requesting removal directly through your county’s website.
Purchase Details
Home Values in the Area
Average Home Value in this Area
Purchase History
We collect this data history from publicly available records. To have your information removed, we recommend requesting removal directly through your county’s website.
| Date | Buyer | Sale Price | Title Company |
|---|---|---|---|
| $109,000 | -- |
Mortgage History
We collect this data history from publicly available records. To have your information removed, we recommend requesting removal directly through your county’s website.
| Date | Status | Borrower | Loan Amount |
|---|---|---|---|
| Open | $81,018 | ||
| Closed | $97,000 |
Tax History
We collect this data history from publicly available records. To have your information removed, we recommend requesting removal directly through your county’s website.
| Year | Tax Paid | Tax Assessment Tax Assessment Total Assessment is a certain percentage of the fair market value that is determined by local assessors to be the total taxable value of land and additions on the property. | Land | Improvement |
|---|---|---|---|---|
| 2025 | $5,190 | $512,800 | $200,100 | $312,700 |
| 2024 | $5,183 | $496,000 | $190,500 | $305,500 |
| 2023 | $4,960 | $428,300 | $165,700 | $262,600 |
| 2022 | $4,912 | $399,700 | $150,600 | $249,100 |
| 2021 | $13,411 | $364,300 | $136,800 | $227,500 |
| 2020 | $4,540 | $340,100 | $132,800 | $207,300 |
| 2019 | $12,044 | $320,500 | $126,400 | $194,100 |
| 2018 | $8,246 | $297,800 | $126,400 | $171,400 |
| 2017 | $4,056 | $297,800 | $126,400 | $171,400 |
| 2016 | $3,878 | $261,300 | $121,600 | $139,700 |
| 2015 | $3,744 | $250,800 | $121,600 | $129,200 |
| 2014 | $3,480 | $240,200 | $121,600 | $118,600 |
Map
- 14 Dale Ave
- 40-48 Primrose Hill Rd
- 42 Lannon Ave
- 1905 Lakeview Ave
- 119 Myron St
- 24 Hammock Ct
- 29 Lindsey Ln
- 59 Mill St Unit 301
- 13 Dallas Dr Unit 310
- 13 Dallas Dr Unit 305
- 30 Springdale Rd
- 25 Charles St
- 26 Sunset Rd
- 23 Valley Rd
- 193 Bouchard Ave
- 95 Tennis Plaza Rd Unit 7
- 75 I St
- 231 Bouchard Ave
- 96 I St
- 77 Valley Rd
- 47 Myron St
- 41 Myron St
- 51 Myron St
- 54 Myron St
- 40 Myron St
- 29 Myron St
- 93 Vandette Ave
- 14 Seavey Ave
- 36 Edwards St
- 60 Primrose Hill Rd
- 62 Primrose Hill Rd Unit 2nd Flr
- 62 Primrose Hill Rd Unit 2
- 60 Primrose Hill Rd
- 62 Primrose Hill Rd
- 9 Myron St
- 83 Vandette Ave
- 33 Edwards St
- 75 Myron St
- 56 Primrose Hill Rd
- 98 Vandette Ave
Ask me questions while you tour the home.