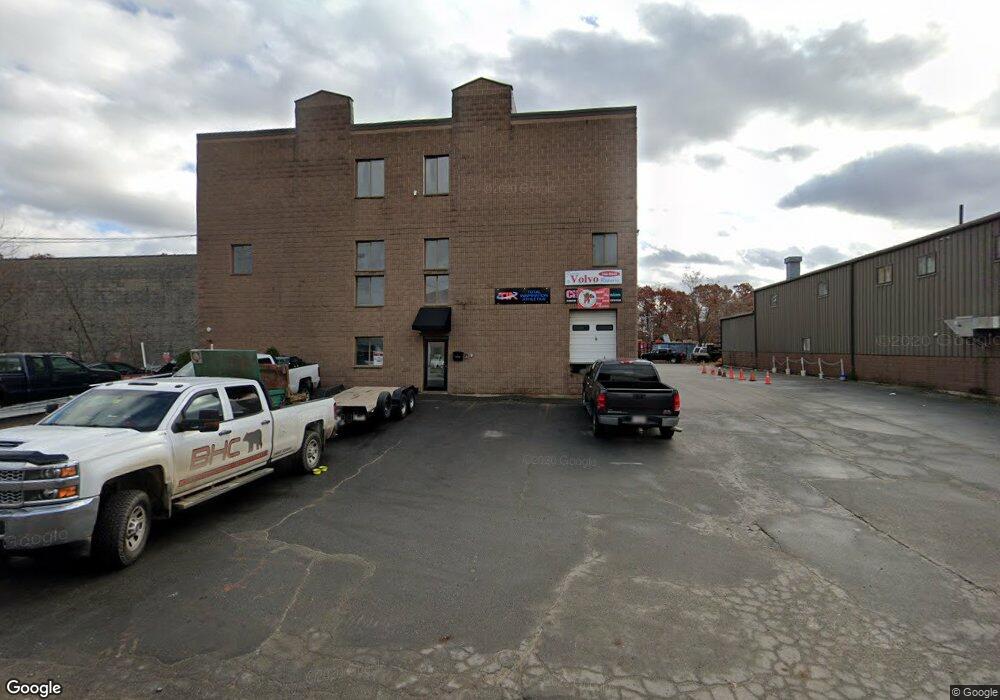
65 New Salem St Unit C Wakefield, MA 01880
Montrose NeighborhoodEstimated Value: $3,818,648
--
Bed
2
Baths
24,280
Sq Ft
$157/Sq Ft
Est. Value
About This Home
This home is located at 65 New Salem St Unit C, Wakefield, MA 01880 and is currently estimated at $3,818,648, approximately $157 per square foot. 65 New Salem St Unit C is a home located in Middlesex County with nearby schools including Wakefield Memorial High School, St Joseph School, and Odyssey Day School.
Ownership History
Date
Name
Owned For
Owner Type
Purchase Details
Closed on
Jul 17, 2002
Sold by
65 New Salem St Llc
Bought by
New Salem 65 Co Llc
Current Estimated Value
Home Financials for this Owner
Home Financials are based on the most recent Mortgage that was taken out on this home.
Original Mortgage
$1,240,000
Interest Rate
6.73%
Mortgage Type
Commercial
Purchase Details
Closed on
Nov 4, 1999
Sold by
Chiardi Rt
Bought by
65 New Salem St Llc
Home Financials for this Owner
Home Financials are based on the most recent Mortgage that was taken out on this home.
Original Mortgage
$700,000
Interest Rate
7.73%
Mortgage Type
Commercial
Create a Home Valuation Report for This Property
The Home Valuation Report is an in-depth analysis detailing your home's value as well as a comparison with similar homes in the area
Home Values in the Area
Average Home Value in this Area
Purchase History
| Date | Buyer | Sale Price | Title Company |
|---|---|---|---|
| New Salem 65 Co Llc | $1,550,000 | -- | |
| 65 New Salem St Llc | $1,200,000 | -- |
Source: Public Records
Mortgage History
| Date | Status | Borrower | Loan Amount |
|---|---|---|---|
| Open | 65 New Salem St Llc | $1,100,000 | |
| Closed | New Salem 65 Co Llc | $1,240,000 | |
| Previous Owner | 65 New Salem St Llc | $700,000 | |
| Previous Owner | 65 New Salem St Llc | $650,000 | |
| Previous Owner | 65 New Salem St Llc | $250,000 |
Source: Public Records
Tax History Compared to Growth
Tax History
| Year | Tax Paid | Tax Assessment Tax Assessment Total Assessment is a certain percentage of the fair market value that is determined by local assessors to be the total taxable value of land and additions on the property. | Land | Improvement |
|---|---|---|---|---|
| 2025 | $41,366 | $1,901,000 | $282,400 | $1,618,600 |
| 2024 | $39,533 | $1,821,800 | $276,900 | $1,544,900 |
| 2023 | $38,806 | $1,727,800 | $261,800 | $1,466,000 |
| 2022 | $39,577 | $1,665,000 | $251,700 | $1,413,300 |
| 2021 | $40,212 | $1,630,000 | $245,800 | $1,384,200 |
| 2020 | $40,620 | $1,630,000 | $245,800 | $1,384,200 |
| 2019 | $39,568 | $1,573,300 | $241,000 | $1,332,300 |
| 2018 | $38,228 | $1,492,700 | $241,000 | $1,251,700 |
| 2017 | $37,384 | $1,440,600 | $241,000 | $1,199,600 |
| 2016 | $38,110 | $1,409,900 | $228,800 | $1,181,100 |
| 2015 | $38,377 | $1,409,900 | $228,800 | $1,181,100 |
| 2014 | $36,756 | $1,409,900 | $228,800 | $1,181,100 |
Source: Public Records
Map
Nearby Homes
- 11 Wilson Ave
- 13 Highland St
- 6 Blue Jay Cir Unit 2
- 16 Pleasant St
- 24 Park St
- 314 Water St Unit 5
- 22 Wayland Rd
- 51 Crescent St
- 22 Jefferson Rd
- 35 Richardson St Unit 2
- 9 Avon St Unit 2
- 48 Cordis St
- 1 Millbrook Ln Unit 304
- 9 Nelson Ave
- 29 Cordis St
- 38 Bennett St Unit 3D
- 134 Nahant St Unit B
- 3 Garden Ln
- 199 Nahant St
- 1 Mansfield Dr