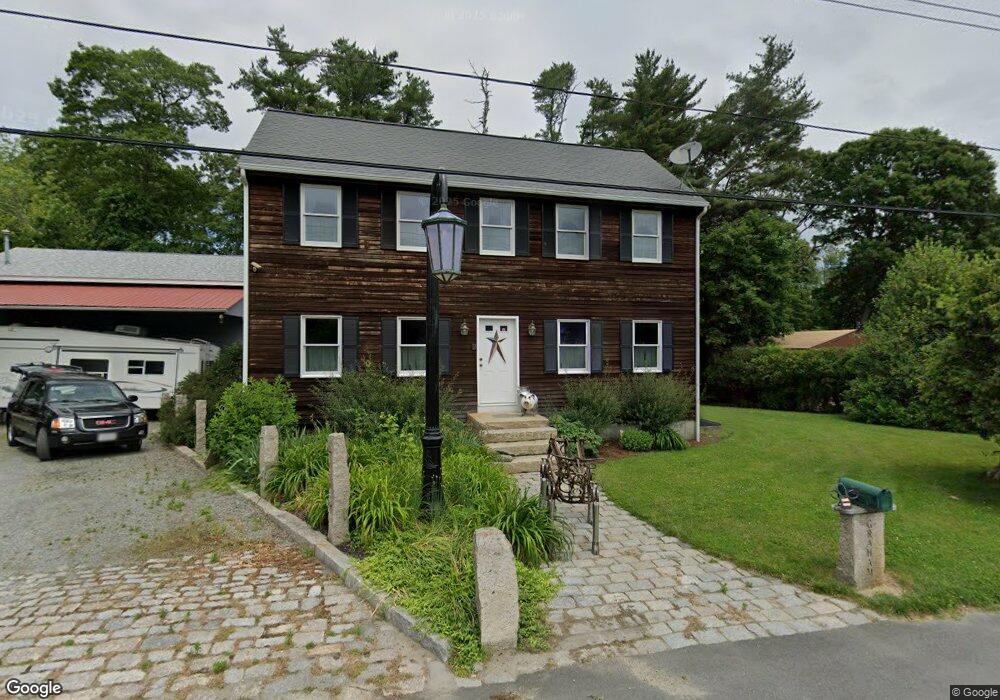
65 Osborn St Westport, MA 02790
North Westport NeighborhoodEstimated Value: $453,000 - $603,000
1
Bed
--
Bath
1,872
Sq Ft
$284/Sq Ft
Est. Value
About This Home
This home is located at 65 Osborn St, Westport, MA 02790 and is currently estimated at $531,729, approximately $284 per square foot. 65 Osborn St is a home located in Bristol County with nearby schools including Alice A. Macomber Primary School, Westport Elementary School, and Westport Middle-High School.
Ownership History
Date
Name
Owned For
Owner Type
Purchase Details
Closed on
Jun 28, 2004
Sold by
Burns Virginia I and Graham Virginia I
Bought by
Graham George A and Graham Virginia I
Current Estimated Value
Home Financials for this Owner
Home Financials are based on the most recent Mortgage that was taken out on this home.
Original Mortgage
$125,000
Interest Rate
6.32%
Mortgage Type
Purchase Money Mortgage
Create a Home Valuation Report for This Property
The Home Valuation Report is an in-depth analysis detailing your home's value as well as a comparison with similar homes in the area
Home Values in the Area
Average Home Value in this Area
Purchase History
| Date | Buyer | Sale Price | Title Company |
|---|---|---|---|
| Graham George A | -- | -- |
Source: Public Records
Mortgage History
| Date | Status | Borrower | Loan Amount |
|---|---|---|---|
| Open | Graham George A | $189,400 | |
| Closed | Graham George A | $125,000 | |
| Previous Owner | Graham George A | $50,000 | |
| Previous Owner | Graham George A | $20,000 |
Source: Public Records
Tax History Compared to Growth
Tax History
| Year | Tax Paid | Tax Assessment Tax Assessment Total Assessment is a certain percentage of the fair market value that is determined by local assessors to be the total taxable value of land and additions on the property. | Land | Improvement |
|---|---|---|---|---|
| 2025 | $3,352 | $449,900 | $151,700 | $298,200 |
| 2024 | $3,347 | $433,000 | $140,600 | $292,400 |
| 2023 | $3,363 | $412,100 | $127,500 | $284,600 |
| 2022 | $3,142 | $375,500 | $121,100 | $254,400 |
| 2021 | $3,142 | $364,500 | $110,100 | $254,400 |
| 2020 | $2,989 | $354,600 | $100,200 | $254,400 |
| 2019 | $2,823 | $341,300 | $100,200 | $241,100 |
| 2018 | $2,804 | $343,200 | $87,200 | $256,000 |
| 2017 | $2,790 | $350,100 | $93,200 | $256,900 |
| 2016 | $2,543 | $321,500 | $88,400 | $233,100 |
| 2015 | $2,575 | $324,700 | $101,500 | $223,200 |
Source: Public Records
Map
Nearby Homes