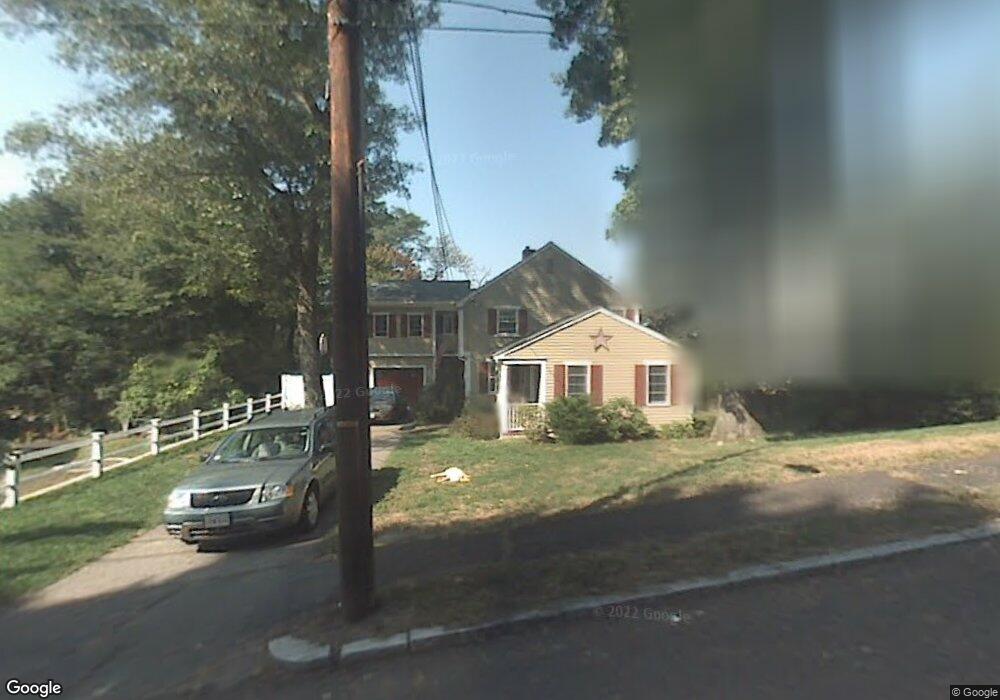
65 Outlook Rd Wakefield, MA 01880
West Side NeighborhoodEstimated Value: $924,000 - $1,083,000
4
Beds
3
Baths
2,434
Sq Ft
$414/Sq Ft
Est. Value
About This Home
This home is located at 65 Outlook Rd, Wakefield, MA 01880 and is currently estimated at $1,007,181, approximately $413 per square foot. 65 Outlook Rd is a home located in Middlesex County with nearby schools including Wakefield Memorial High School, St Joseph School, and St. Patrick Elementary School.
Ownership History
Date
Name
Owned For
Owner Type
Purchase Details
Closed on
Sep 15, 1993
Sold by
Lanigan Kevin B and Lanigan Junean
Bought by
Reardon Gerald and Reardon Irene B
Current Estimated Value
Purchase Details
Closed on
Aug 1, 1989
Sold by
Brown Ormonds L
Bought by
Lanigan Kevinb
Create a Home Valuation Report for This Property
The Home Valuation Report is an in-depth analysis detailing your home's value as well as a comparison with similar homes in the area
Home Values in the Area
Average Home Value in this Area
Purchase History
| Date | Buyer | Sale Price | Title Company |
|---|---|---|---|
| Reardon Gerald | $172,000 | -- | |
| Reardon Gerald | $172,000 | -- | |
| Lanigan Kevinb | $209,000 | -- | |
| Lanigan Kevinb | $209,000 | -- |
Source: Public Records
Mortgage History
| Date | Status | Borrower | Loan Amount |
|---|---|---|---|
| Open | Lanigan Kevinb | $404,300 | |
| Closed | Lanigan Kevinb | $217,000 |
Source: Public Records
Tax History
| Year | Tax Paid | Tax Assessment Tax Assessment Total Assessment is a certain percentage of the fair market value that is determined by local assessors to be the total taxable value of land and additions on the property. | Land | Improvement |
|---|---|---|---|---|
| 2025 | $10,060 | $886,300 | $403,900 | $482,400 |
| 2024 | $9,678 | $860,300 | $392,000 | $468,300 |
| 2023 | $9,345 | $796,700 | $363,000 | $433,700 |
| 2022 | $8,923 | $724,300 | $330,000 | $394,300 |
| 2021 | $8,697 | $683,200 | $306,600 | $376,600 |
| 2020 | $8,363 | $654,900 | $293,900 | $361,000 |
| 2019 | $8,114 | $632,400 | $283,800 | $348,600 |
| 2018 | $7,678 | $592,900 | $266,100 | $326,800 |
| 2017 | $7,357 | $564,600 | $253,400 | $311,200 |
| 2016 | $6,943 | $514,700 | $234,200 | $280,500 |
| 2015 | $6,485 | $481,100 | $218,900 | $262,200 |
| 2014 | $5,958 | $466,200 | $212,100 | $254,100 |
Source: Public Records
Map
Nearby Homes
- 80 Redfield Rd
- 2 Summit Dr Unit 43
- 1 Summit Dr Unit 57
- 311 Gazebo Cir Unit 311
- 403 Gazebo Cir
- 1014 Gazebo Cir Unit 1014
- 95 Prospect St
- 4 Adams St
- 241 Main St Unit C3
- 64 Main St Unit 24B
- 12 Isola Ln
- 66 Main St Unit 15A
- 313 South St
- 20 Pinevale Ave
- 75 Augustus Ct Unit 2003
- 62 High St Unit Lot 8
- 62 High St Unit 4
- 62 High St Unit Lot 5
- 62 High St Unit Lot 12
- 98 Main St Unit 2
Your Personal Tour Guide
Ask me questions while you tour the home.