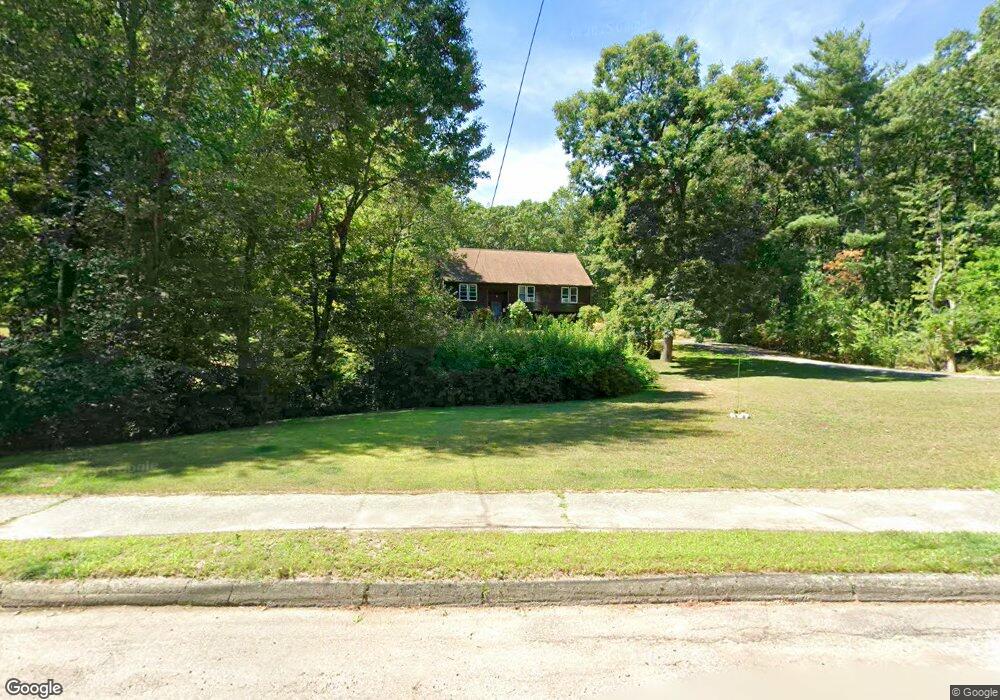
65 Oxbow Dr Wrentham, MA 02093
Estimated Value: $776,665 - $926,000
4
Beds
4
Baths
2,724
Sq Ft
$315/Sq Ft
Est. Value
About This Home
This home is located at 65 Oxbow Dr, Wrentham, MA 02093 and is currently estimated at $858,416, approximately $315 per square foot. 65 Oxbow Dr is a home located in Norfolk County with nearby schools including Delaney Elementary School, Charles E Roderick, and Mercymount Country Day School.
Ownership History
Date
Name
Owned For
Owner Type
Purchase Details
Closed on
Feb 1, 1989
Sold by
Johnston Arthur L
Bought by
Savi John
Current Estimated Value
Home Financials for this Owner
Home Financials are based on the most recent Mortgage that was taken out on this home.
Original Mortgage
$88,000
Interest Rate
10.62%
Mortgage Type
Purchase Money Mortgage
Create a Home Valuation Report for This Property
The Home Valuation Report is an in-depth analysis detailing your home's value as well as a comparison with similar homes in the area
Purchase History
| Date | Buyer | Sale Price | Title Company |
|---|---|---|---|
| Savi John | $193,000 | -- |
Source: Public Records
Mortgage History
| Date | Status | Borrower | Loan Amount |
|---|---|---|---|
| Open | Savi John | $100,000 | |
| Closed | Savi John | $81,000 | |
| Closed | Savi John | $88,000 |
Source: Public Records
Tax History
| Year | Tax Paid | Tax Assessment Tax Assessment Total Assessment is a certain percentage of the fair market value that is determined by local assessors to be the total taxable value of land and additions on the property. | Land | Improvement |
|---|---|---|---|---|
| 2025 | $7,670 | $661,800 | $302,500 | $359,300 |
| 2024 | $7,247 | $603,900 | $302,500 | $301,400 |
| 2023 | $7,028 | $556,900 | $274,900 | $282,000 |
| 2022 | $6,801 | $497,500 | $256,400 | $241,100 |
| 2021 | $5,679 | $403,600 | $223,800 | $179,800 |
| 2020 | $6,519 | $457,500 | $199,000 | $258,500 |
| 2019 | $6,230 | $441,200 | $199,000 | $242,200 |
| 2018 | $6,008 | $421,900 | $199,200 | $222,700 |
| 2017 | $5,664 | $397,500 | $195,400 | $202,100 |
| 2016 | $5,541 | $388,000 | $189,700 | $198,300 |
| 2015 | $5,346 | $356,900 | $182,400 | $174,500 |
| 2014 | $5,291 | $345,600 | $175,400 | $170,200 |
Source: Public Records
Map
Nearby Homes
- 613 West St
- 440 Chestnut St
- 10 Earle Stewart Ln Unit Lot 5
- 12 Earle Stewart Ln
- 2 Earle Stewart Ln
- 3 Earle Stewart Ln
- 1222 South St
- 135 Creek St Unit 2
- 440 South St
- 165 Wampum St
- 23 Horseshoe Dr
- 20 Field Cir
- 19 Chestnut St Lot 2
- 19 Chestnut St Lot 3
- 0 Berry St
- 1 Chestnut St
- 6 Woodchester Rd
- 500 Franklin St
- 10 Nature View Dr
- 15 Nature View Dr
Your Personal Tour Guide
Ask me questions while you tour the home.