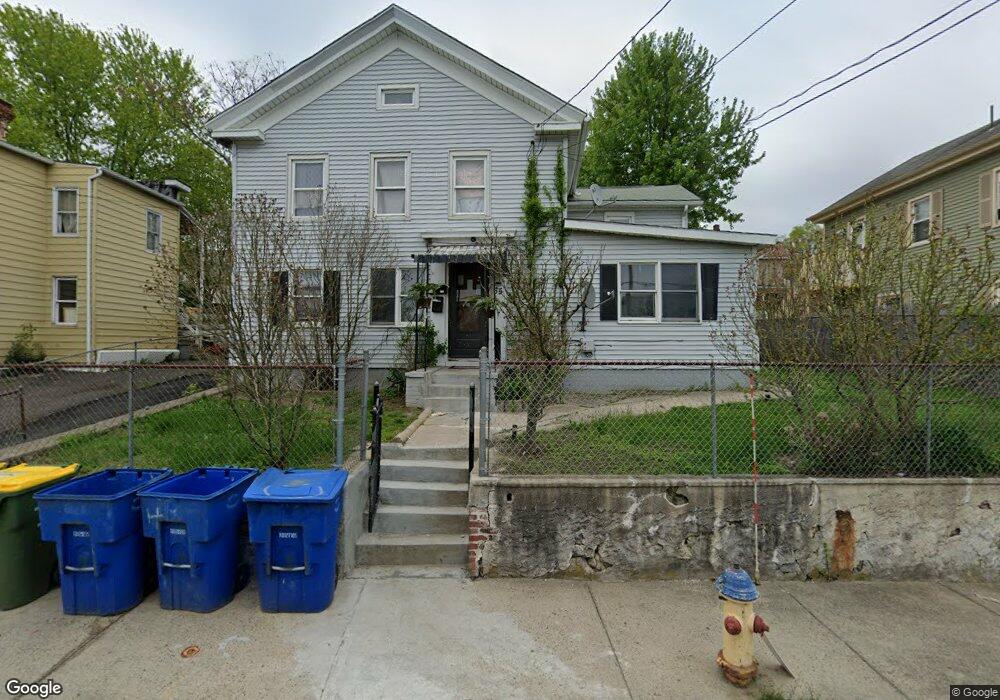
65 Pemberton St Waterbury, CT 06706
South End District NeighborhoodEstimated Value: $219,000 - $289,000
6
Beds
3
Baths
1,864
Sq Ft
$135/Sq Ft
Est. Value
About This Home
This home is located at 65 Pemberton St, Waterbury, CT 06706 and is currently estimated at $251,568, approximately $134 per square foot. 65 Pemberton St is a home located in New Haven County with nearby schools including Wendell L. Cross Elementary School, Michael F. Wallace Middle School, and Crosby High School.
Ownership History
Date
Name
Owned For
Owner Type
Purchase Details
Closed on
Sep 29, 2021
Sold by
Collection Frank C
Bought by
Collection Frank C
Current Estimated Value
Purchase Details
Closed on
Nov 13, 2009
Sold by
Baucom Sally
Bought by
Watson Valerie and Watson David
Purchase Details
Closed on
May 18, 2004
Sold by
Soares Julia
Bought by
Baucom Sally
Home Financials for this Owner
Home Financials are based on the most recent Mortgage that was taken out on this home.
Original Mortgage
$90,000
Interest Rate
5.47%
Mortgage Type
Purchase Money Mortgage
Purchase Details
Closed on
Jan 19, 1999
Sold by
Jesus Manuel P and Jesus Dorinda G
Bought by
Silva Luis and Silva Julia Sb
Create a Home Valuation Report for This Property
The Home Valuation Report is an in-depth analysis detailing your home's value as well as a comparison with similar homes in the area
Home Values in the Area
Average Home Value in this Area
Purchase History
| Date | Buyer | Sale Price | Title Company |
|---|---|---|---|
| Collection Frank C | -- | None Available | |
| Watson Valerie | -- | -- | |
| Baucom Sally | $100,000 | -- | |
| Silva Luis | $75,000 | -- |
Source: Public Records
Mortgage History
| Date | Status | Borrower | Loan Amount |
|---|---|---|---|
| Previous Owner | Silva Luis | $3,800 | |
| Previous Owner | Silva Luis | $142,800 | |
| Previous Owner | Silva Luis | $90,000 |
Source: Public Records
Tax History Compared to Growth
Tax History
| Year | Tax Paid | Tax Assessment Tax Assessment Total Assessment is a certain percentage of the fair market value that is determined by local assessors to be the total taxable value of land and additions on the property. | Land | Improvement |
|---|---|---|---|---|
| 2025 | $3,432 | $76,300 | $7,700 | $68,600 |
| 2024 | $3,772 | $76,300 | $7,700 | $68,600 |
| 2023 | $4,135 | $76,300 | $7,700 | $68,600 |
| 2022 | $2,273 | $37,750 | $7,740 | $30,010 |
| 2021 | $2,273 | $37,750 | $7,740 | $30,010 |
| 2020 | $2,273 | $37,750 | $7,740 | $30,010 |
| 2019 | $2,273 | $37,750 | $7,740 | $30,010 |
| 2018 | $2,273 | $37,750 | $7,740 | $30,010 |
| 2017 | $2,286 | $37,960 | $7,740 | $30,220 |
| 2016 | $2,286 | $37,960 | $7,740 | $30,220 |
| 2015 | $2,210 | $37,960 | $7,740 | $30,220 |
| 2014 | $2,210 | $37,960 | $7,740 | $30,220 |
Source: Public Records
Map
Nearby Homes