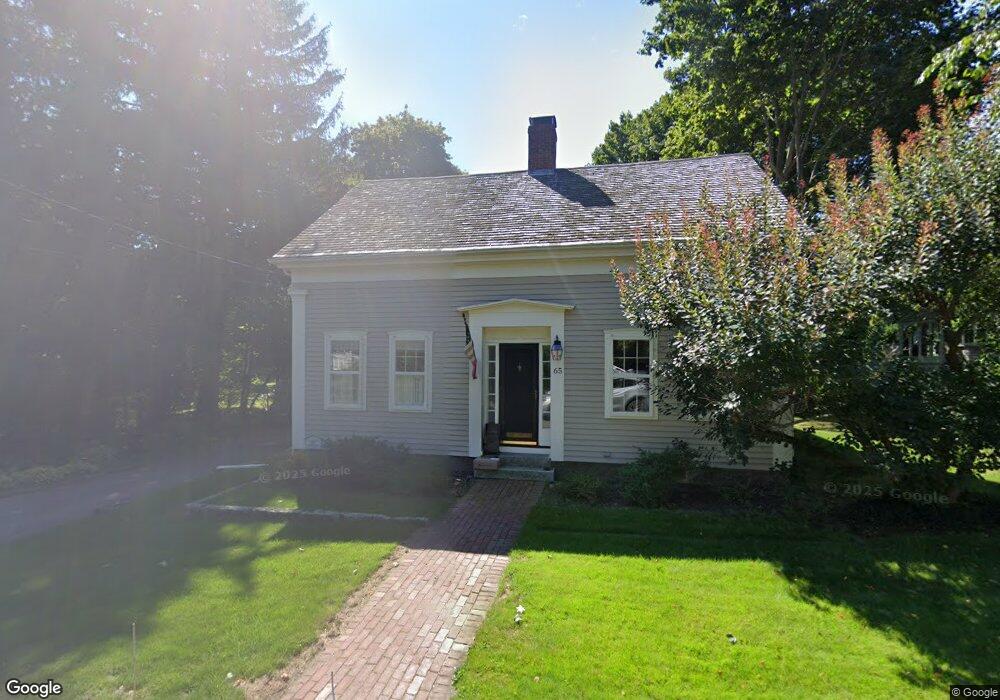
65 Pleasant St Hingham, MA 02043
Estimated Value: $1,260,000 - $1,519,000
3
Beds
3
Baths
1,997
Sq Ft
$701/Sq Ft
Est. Value
About This Home
This home is located at 65 Pleasant St, Hingham, MA 02043 and is currently estimated at $1,400,629, approximately $701 per square foot. 65 Pleasant St is a home located in Plymouth County with nearby schools including East Elementary School, Hingham Middle School, and Hingham High School.
Ownership History
Date
Name
Owned For
Owner Type
Purchase Details
Closed on
Sep 10, 2004
Sold by
Johnson Robert G and Johnson Kathryn M
Bought by
Jones Michael J and Jones Elizabeth C
Current Estimated Value
Home Financials for this Owner
Home Financials are based on the most recent Mortgage that was taken out on this home.
Original Mortgage
$774,250
Outstanding Balance
$388,691
Interest Rate
6.08%
Mortgage Type
Purchase Money Mortgage
Estimated Equity
$1,011,938
Purchase Details
Closed on
May 18, 2001
Sold by
Mcgirr Thomas H and Mcgirr Jennie E
Bought by
Johnson Robert G and Johnson Kathryn M
Purchase Details
Closed on
Jun 30, 1995
Sold by
Edmundson Philip and Edmundson Deborah
Bought by
Mcgirr Thoms H and Mitman Jennie E
Purchase Details
Closed on
Sep 15, 1988
Sold by
Feingold John E
Bought by
Edmundson Philip
Create a Home Valuation Report for This Property
The Home Valuation Report is an in-depth analysis detailing your home's value as well as a comparison with similar homes in the area
Purchase History
| Date | Buyer | Sale Price | Title Company |
|---|---|---|---|
| Jones Michael J | $815,000 | -- | |
| Jones Michael J | $815,000 | -- | |
| Johnson Robert G | $589,000 | -- | |
| Mcgirr Thoms H | $322,500 | -- | |
| Mcgirr Thomas H | $322,500 | -- | |
| Edmundson Philip | $225,000 | -- |
Source: Public Records
Mortgage History
| Date | Status | Borrower | Loan Amount |
|---|---|---|---|
| Open | Edmundson Philip | $90,000 | |
| Open | Edmundson Philip | $774,250 |
Source: Public Records
Tax History
| Year | Tax Paid | Tax Assessment Tax Assessment Total Assessment is a certain percentage of the fair market value that is determined by local assessors to be the total taxable value of land and additions on the property. | Land | Improvement |
|---|---|---|---|---|
| 2025 | $12,058 | $1,128,000 | $592,600 | $535,400 |
| 2024 | $12,110 | $1,116,100 | $592,600 | $523,500 |
| 2023 | $10,792 | $1,079,200 | $592,600 | $486,600 |
| 2022 | $10,854 | $938,900 | $534,900 | $404,000 |
| 2021 | $10,650 | $902,500 | $514,400 | $388,100 |
| 2020 | $10,406 | $902,500 | $514,400 | $388,100 |
| 2019 | $10,577 | $895,600 | $514,400 | $381,200 |
| 2018 | $10,139 | $861,400 | $514,400 | $347,000 |
| 2017 | $10,047 | $820,200 | $534,900 | $285,300 |
| 2016 | $9,926 | $794,700 | $509,400 | $285,300 |
| 2015 | $9,652 | $770,300 | $485,000 | $285,300 |
Source: Public Records
Map
Nearby Homes
Your Personal Tour Guide
Ask me questions while you tour the home.