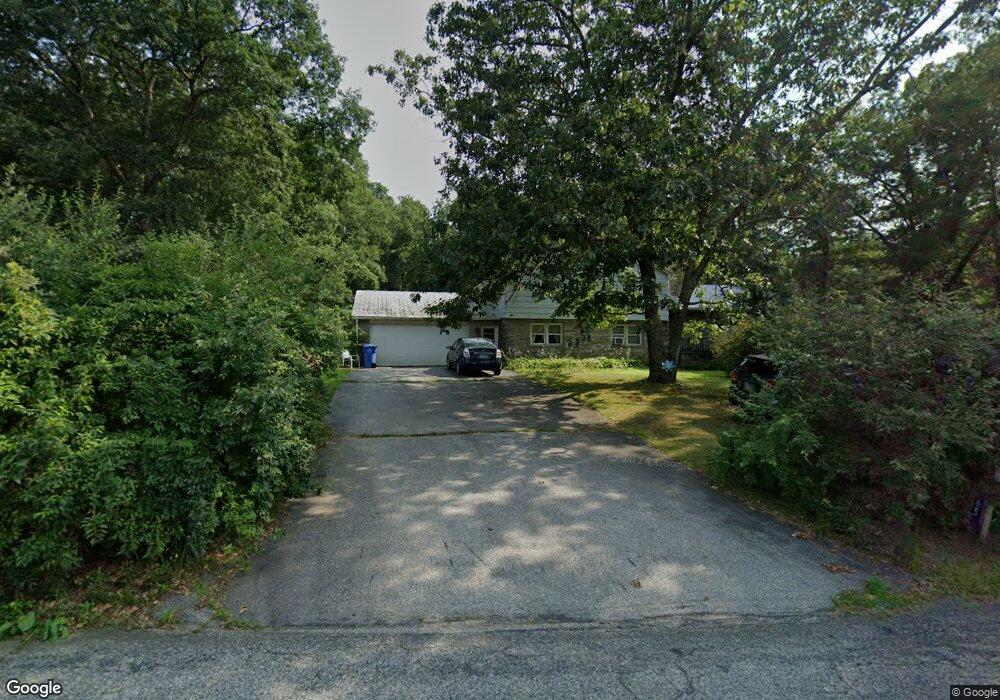
65 Quinebaug Dr Danielson, CT 06239
Estimated Value: $332,000 - $337,000
4
Beds
3
Baths
860
Sq Ft
$388/Sq Ft
Est. Value
About This Home
This home is located at 65 Quinebaug Dr, Danielson, CT 06239 and is currently estimated at $333,629, approximately $387 per square foot. 65 Quinebaug Dr is a home located in Windham County with nearby schools including Killingly Central School, Killingly Memorial School, and Killingly Intermediate School.
Ownership History
Date
Name
Owned For
Owner Type
Purchase Details
Closed on
Nov 19, 2020
Sold by
Merritt Todd M
Bought by
Gonzalez Stefanie
Current Estimated Value
Home Financials for this Owner
Home Financials are based on the most recent Mortgage that was taken out on this home.
Original Mortgage
$222,832
Outstanding Balance
$198,289
Interest Rate
2.8%
Mortgage Type
FHA
Estimated Equity
$135,340
Purchase Details
Closed on
Nov 30, 2007
Sold by
Charron Matthew M and Charron Maurila N
Bought by
Merritt Todd M
Home Financials for this Owner
Home Financials are based on the most recent Mortgage that was taken out on this home.
Original Mortgage
$190,200
Interest Rate
6.48%
Purchase Details
Closed on
Nov 2, 2000
Sold by
Kempf Warren J and Kempf Brenda L
Bought by
Charron Matthew M and Charron Maurila N
Purchase Details
Closed on
Jul 11, 1996
Sold by
Ballard Lucille G and Martin Doris B
Bought by
Kempf Warren J and Kempf Brenda L
Create a Home Valuation Report for This Property
The Home Valuation Report is an in-depth analysis detailing your home's value as well as a comparison with similar homes in the area
Home Values in the Area
Average Home Value in this Area
Purchase History
| Date | Buyer | Sale Price | Title Company |
|---|---|---|---|
| Gonzalez Stefanie | $212,000 | None Available | |
| Gonzalez Stefanie | $212,000 | None Available | |
| Merritt Todd M | $186,500 | -- | |
| Merritt Todd M | $186,500 | -- | |
| Charron Matthew M | $92,000 | -- | |
| Charron Matthew M | $92,000 | -- | |
| Kempf Warren J | $82,500 | -- | |
| Kempf Warren J | $82,500 | -- |
Source: Public Records
Mortgage History
| Date | Status | Borrower | Loan Amount |
|---|---|---|---|
| Open | Gonzalez Stefanie | $222,832 | |
| Closed | Gonzalez Stefanie | $222,832 | |
| Previous Owner | Kempf Warren J | $190,200 |
Source: Public Records
Tax History
| Year | Tax Paid | Tax Assessment Tax Assessment Total Assessment is a certain percentage of the fair market value that is determined by local assessors to be the total taxable value of land and additions on the property. | Land | Improvement |
|---|---|---|---|---|
| 2025 | $3,203 | $146,710 | $40,990 | $105,720 |
| 2024 | $3,037 | $146,710 | $40,990 | $105,720 |
| 2023 | $3,170 | $115,780 | $33,670 | $82,110 |
| 2022 | $2,969 | $115,780 | $33,670 | $82,110 |
| 2021 | $2,969 | $115,780 | $33,670 | $82,110 |
| 2020 | $2,911 | $115,780 | $33,670 | $82,110 |
| 2019 | $2,948 | $115,780 | $33,670 | $82,110 |
| 2017 | $2,609 | $93,800 | $26,670 | $67,130 |
| 2016 | $2,609 | $93,800 | $26,670 | $67,130 |
| 2015 | $2,609 | $93,800 | $26,670 | $67,130 |
| 2014 | $2,467 | $91,350 | $26,670 | $64,680 |
Source: Public Records
Map
Nearby Homes
- 147 South St
- 37 Cady St
- 10 Cote Dr
- 247 Green Hollow Rd
- 43 Fall Brook Rd
- 20 Wauregan Rd
- 33 Junior Ave
- 53 S Main St
- 0 Allen Hill Rd Unit 24140370
- 35 S Main St
- 0 Providence Rd Unit 24080985
- 23 Tiffany St
- 454 Providence Rd
- 405 Providence Rd
- 423 Providence Rd
- 22 Jolley Rd
- 18 Broad St
- 106 Water St
- 37 Katherine Ave
- 85 Furnace St
- 69 Quinebaug Dr
- 57 Quinebaug Dr
- 17 Black Rock Ave
- 73 Quinebaug Dr
- 21 Black Rock Ave
- 66 Quinebaug Dr
- 60 Quinebaug Dr
- 32 Edwardsen St
- 25 Black Rock Ave
- 38 Edwardsen St
- 10 Black Rock Ave
- 54 Quinebaug Dr
- 18 Black Rock Ave
- 4 Black Rock Ave
- 44 Edwardsen St
- 26 Edwardsen St
- 22 Black Rock Ave
- 48 Edwardsen St
- 26 Black Rock Ave
- 43 Edwardsen St
Your Personal Tour Guide
Ask me questions while you tour the home.