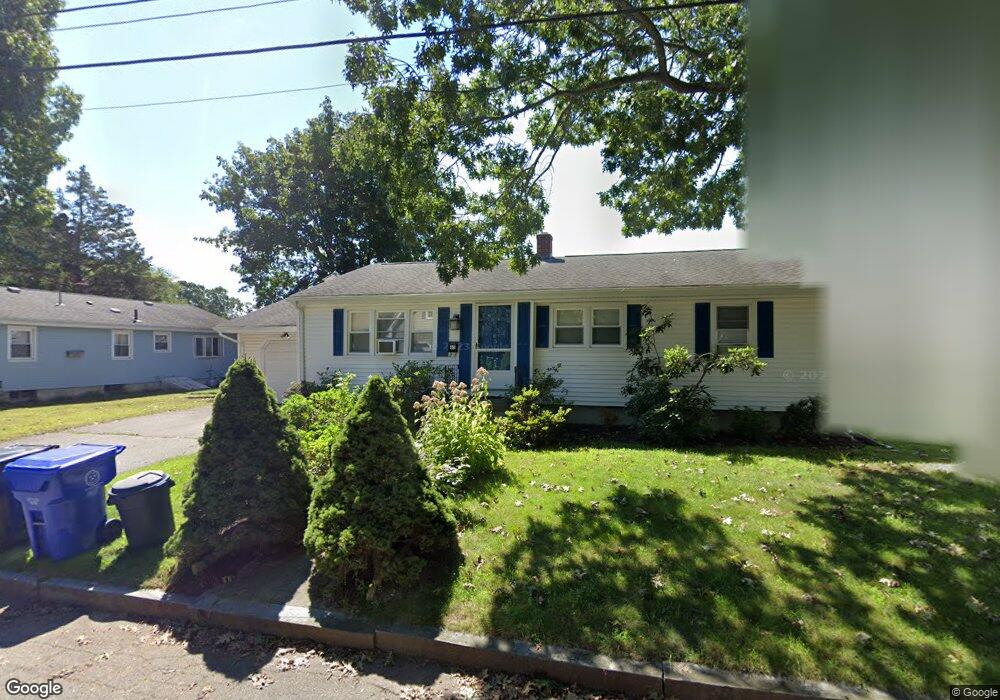
65 Ramsay St Riverside, RI 02915
Riverside NeighborhoodEstimated Value: $399,369 - $429,000
3
Beds
2
Baths
1,028
Sq Ft
$398/Sq Ft
Est. Value
About This Home
This home is located at 65 Ramsay St, Riverside, RI 02915 and is currently estimated at $409,092, approximately $397 per square foot. 65 Ramsay St is a home located in Providence County with nearby schools including East Providence High School, St Luke Elementary School, and Barrington Christian Academy.
Ownership History
Date
Name
Owned For
Owner Type
Purchase Details
Closed on
Oct 20, 2006
Sold by
Mayer Brian and Chraft Jenelle
Bought by
Medeiros Edward
Current Estimated Value
Home Financials for this Owner
Home Financials are based on the most recent Mortgage that was taken out on this home.
Original Mortgage
$229,000
Outstanding Balance
$134,030
Interest Rate
6.49%
Mortgage Type
Purchase Money Mortgage
Estimated Equity
$275,062
Purchase Details
Closed on
Aug 30, 2002
Sold by
Silva Raymond and Silva Raymond
Bought by
Chraft Jenelle E and Mayer Brian M
Create a Home Valuation Report for This Property
The Home Valuation Report is an in-depth analysis detailing your home's value as well as a comparison with similar homes in the area
Home Values in the Area
Average Home Value in this Area
Purchase History
| Date | Buyer | Sale Price | Title Company |
|---|---|---|---|
| Medeiros Edward | $229,000 | -- | |
| Chraft Jenelle E | $168,000 | -- | |
| Medeiros Edward | $229,000 | -- | |
| Chraft Jenelle E | $168,000 | -- |
Source: Public Records
Mortgage History
| Date | Status | Borrower | Loan Amount |
|---|---|---|---|
| Open | Chraft Jenelle E | $229,000 | |
| Closed | Chraft Jenelle E | $229,000 | |
| Previous Owner | Chraft Jenelle E | $35,000 |
Source: Public Records
Tax History
| Year | Tax Paid | Tax Assessment Tax Assessment Total Assessment is a certain percentage of the fair market value that is determined by local assessors to be the total taxable value of land and additions on the property. | Land | Improvement |
|---|---|---|---|---|
| 2025 | $4,411 | $337,500 | $80,500 | $257,000 |
| 2024 | $4,372 | $285,200 | $67,100 | $218,100 |
| 2023 | $4,210 | $285,200 | $67,100 | $218,100 |
| 2022 | $4,195 | $191,900 | $37,100 | $154,800 |
| 2021 | $4,126 | $191,900 | $37,100 | $154,800 |
| 2020 | $3,951 | $191,900 | $37,100 | $154,800 |
| 2019 | $3,842 | $191,900 | $37,100 | $154,800 |
| 2018 | $3,775 | $165,000 | $39,600 | $125,400 |
| 2017 | $3,691 | $165,000 | $39,600 | $125,400 |
| 2016 | $3,673 | $165,000 | $39,600 | $125,400 |
| 2015 | $3,465 | $151,000 | $36,700 | $114,300 |
| 2014 | $3,465 | $151,000 | $36,700 | $114,300 |
Source: Public Records
Map
Nearby Homes
- 236 Becker Ave
- 85 Hilton Ave
- 45 Washington Rd
- 15 Claire St
- 14 Winthrop St
- 14 Benedict St
- 0 Carousel Dr
- 168 Washington Rd
- 11 Elton Rd
- 22 Grassy Plain Rd
- 79 Sherman St
- 20 Townsend St
- 47 Dartmouth Ave
- 916 Bullocks Pt Ave
- 6 Hazelton Rd
- 41 White Ave
- 9 Mystic Ave
- 71 Alfred Drown Rd
- 56 Knowlton St
- 38 Meadowcrest Dr
Your Personal Tour Guide
Ask me questions while you tour the home.