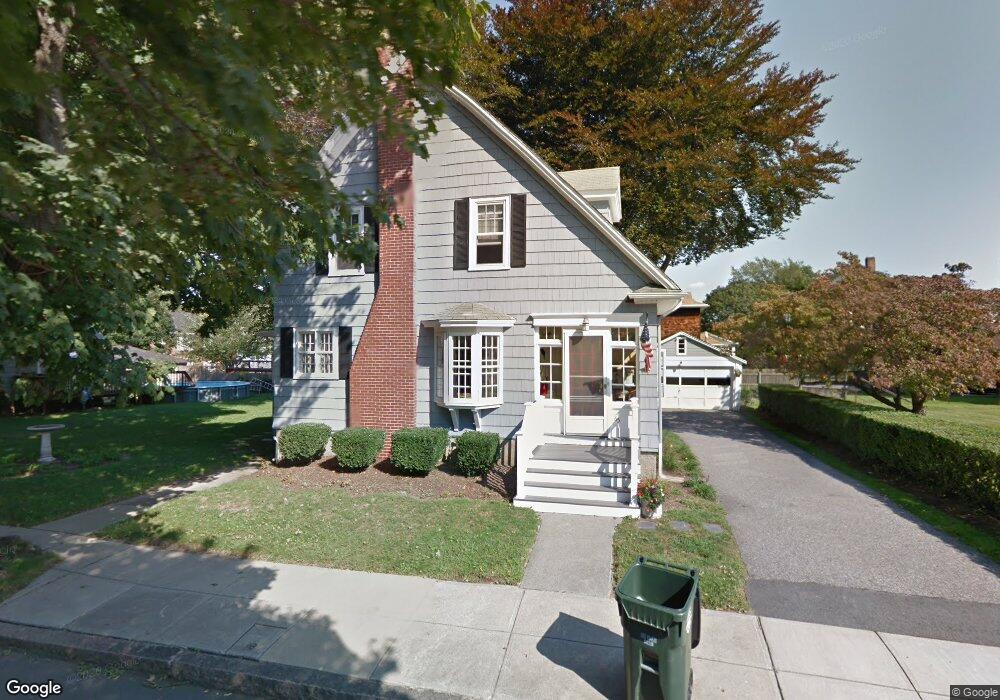
65 Read St Fall River, MA 02720
Highlands-Fall River NeighborhoodEstimated Value: $383,000 - $523,000
3
Beds
2
Baths
1,654
Sq Ft
$271/Sq Ft
Est. Value
About This Home
This home is located at 65 Read St, Fall River, MA 02720 and is currently estimated at $448,392, approximately $271 per square foot. 65 Read St is a home located in Bristol County with nearby schools including Spencer Borden Elementary School, Morton Middle School, and B M C Durfee High School.
Ownership History
Date
Name
Owned For
Owner Type
Purchase Details
Closed on
Nov 1, 2010
Sold by
Boyle Christopher L
Bought by
Camara John and Lanza Lynn
Current Estimated Value
Home Financials for this Owner
Home Financials are based on the most recent Mortgage that was taken out on this home.
Original Mortgage
$239,277
Outstanding Balance
$158,834
Interest Rate
4.39%
Mortgage Type
Purchase Money Mortgage
Estimated Equity
$289,558
Purchase Details
Closed on
May 31, 2001
Sold by
Peters Ralph F and Ofiesh-Peters Nicole
Bought by
Boyle Christopher and Boyle Rebecca
Purchase Details
Closed on
Jan 4, 1999
Sold by
Odonnell-Burrello S and Odonnell Mary V
Bought by
Peters Ralph F and Ofiesh-Peters Nicole
Create a Home Valuation Report for This Property
The Home Valuation Report is an in-depth analysis detailing your home's value as well as a comparison with similar homes in the area
Home Values in the Area
Average Home Value in this Area
Purchase History
| Date | Buyer | Sale Price | Title Company |
|---|---|---|---|
| Camara John | $242,500 | -- | |
| Boyle Christopher | $168,000 | -- | |
| Peters Ralph F | $119,900 | -- |
Source: Public Records
Mortgage History
| Date | Status | Borrower | Loan Amount |
|---|---|---|---|
| Open | Camara John | $239,277 | |
| Previous Owner | Peters Ralph F | $25,000 | |
| Previous Owner | Peters Ralph F | $25,000 | |
| Previous Owner | Peters Ralph F | $162,999 | |
| Previous Owner | Peters Ralph F | $163,550 |
Source: Public Records
Tax History
| Year | Tax Paid | Tax Assessment Tax Assessment Total Assessment is a certain percentage of the fair market value that is determined by local assessors to be the total taxable value of land and additions on the property. | Land | Improvement |
|---|---|---|---|---|
| 2025 | $4,296 | $375,200 | $117,500 | $257,700 |
| 2024 | $4,089 | $355,900 | $115,200 | $240,700 |
| 2023 | $4,079 | $332,400 | $103,800 | $228,600 |
| 2022 | $3,674 | $291,100 | $97,900 | $193,200 |
| 2021 | $3,525 | $254,900 | $93,600 | $161,300 |
| 2020 | $3,308 | $228,900 | $89,300 | $139,600 |
| 2019 | $3,333 | $228,600 | $93,300 | $135,300 |
| 2018 | $3,276 | $224,100 | $91,800 | $132,300 |
| 2017 | $3,108 | $222,000 | $91,800 | $130,200 |
| 2016 | $3,010 | $220,800 | $96,700 | $124,100 |
| 2015 | $2,888 | $220,800 | $96,700 | $124,100 |
| 2014 | $2,778 | $220,800 | $96,700 | $124,100 |
Source: Public Records
Map
Nearby Homes
- 499 Hanover St
- 65 Bigelow St
- 503 Highland Ave
- 301 Madison St
- 108 Garden St
- 545 Robeson St
- 45-47 Shawmut St
- 1231 Robeson St
- 267 Lincoln Ave
- 889 High St
- 909 High St Unit 1
- 72 Belmont St
- 742 New Boston Rd
- 610 Walnut St
- 213 Weetamoe St
- 631 Walnut St
- 25 O'Hearn St
- 499 Maple St
- 273 Tremont St
- 884 Cherry St
Your Personal Tour Guide
Ask me questions while you tour the home.